Rethinking Software Productivity: Metrics That Actually Matter

Software organizations face a critical challenge in measuring and improving developer productivity. While the technology industry spends over $300 billion annually on software development, studies show that:
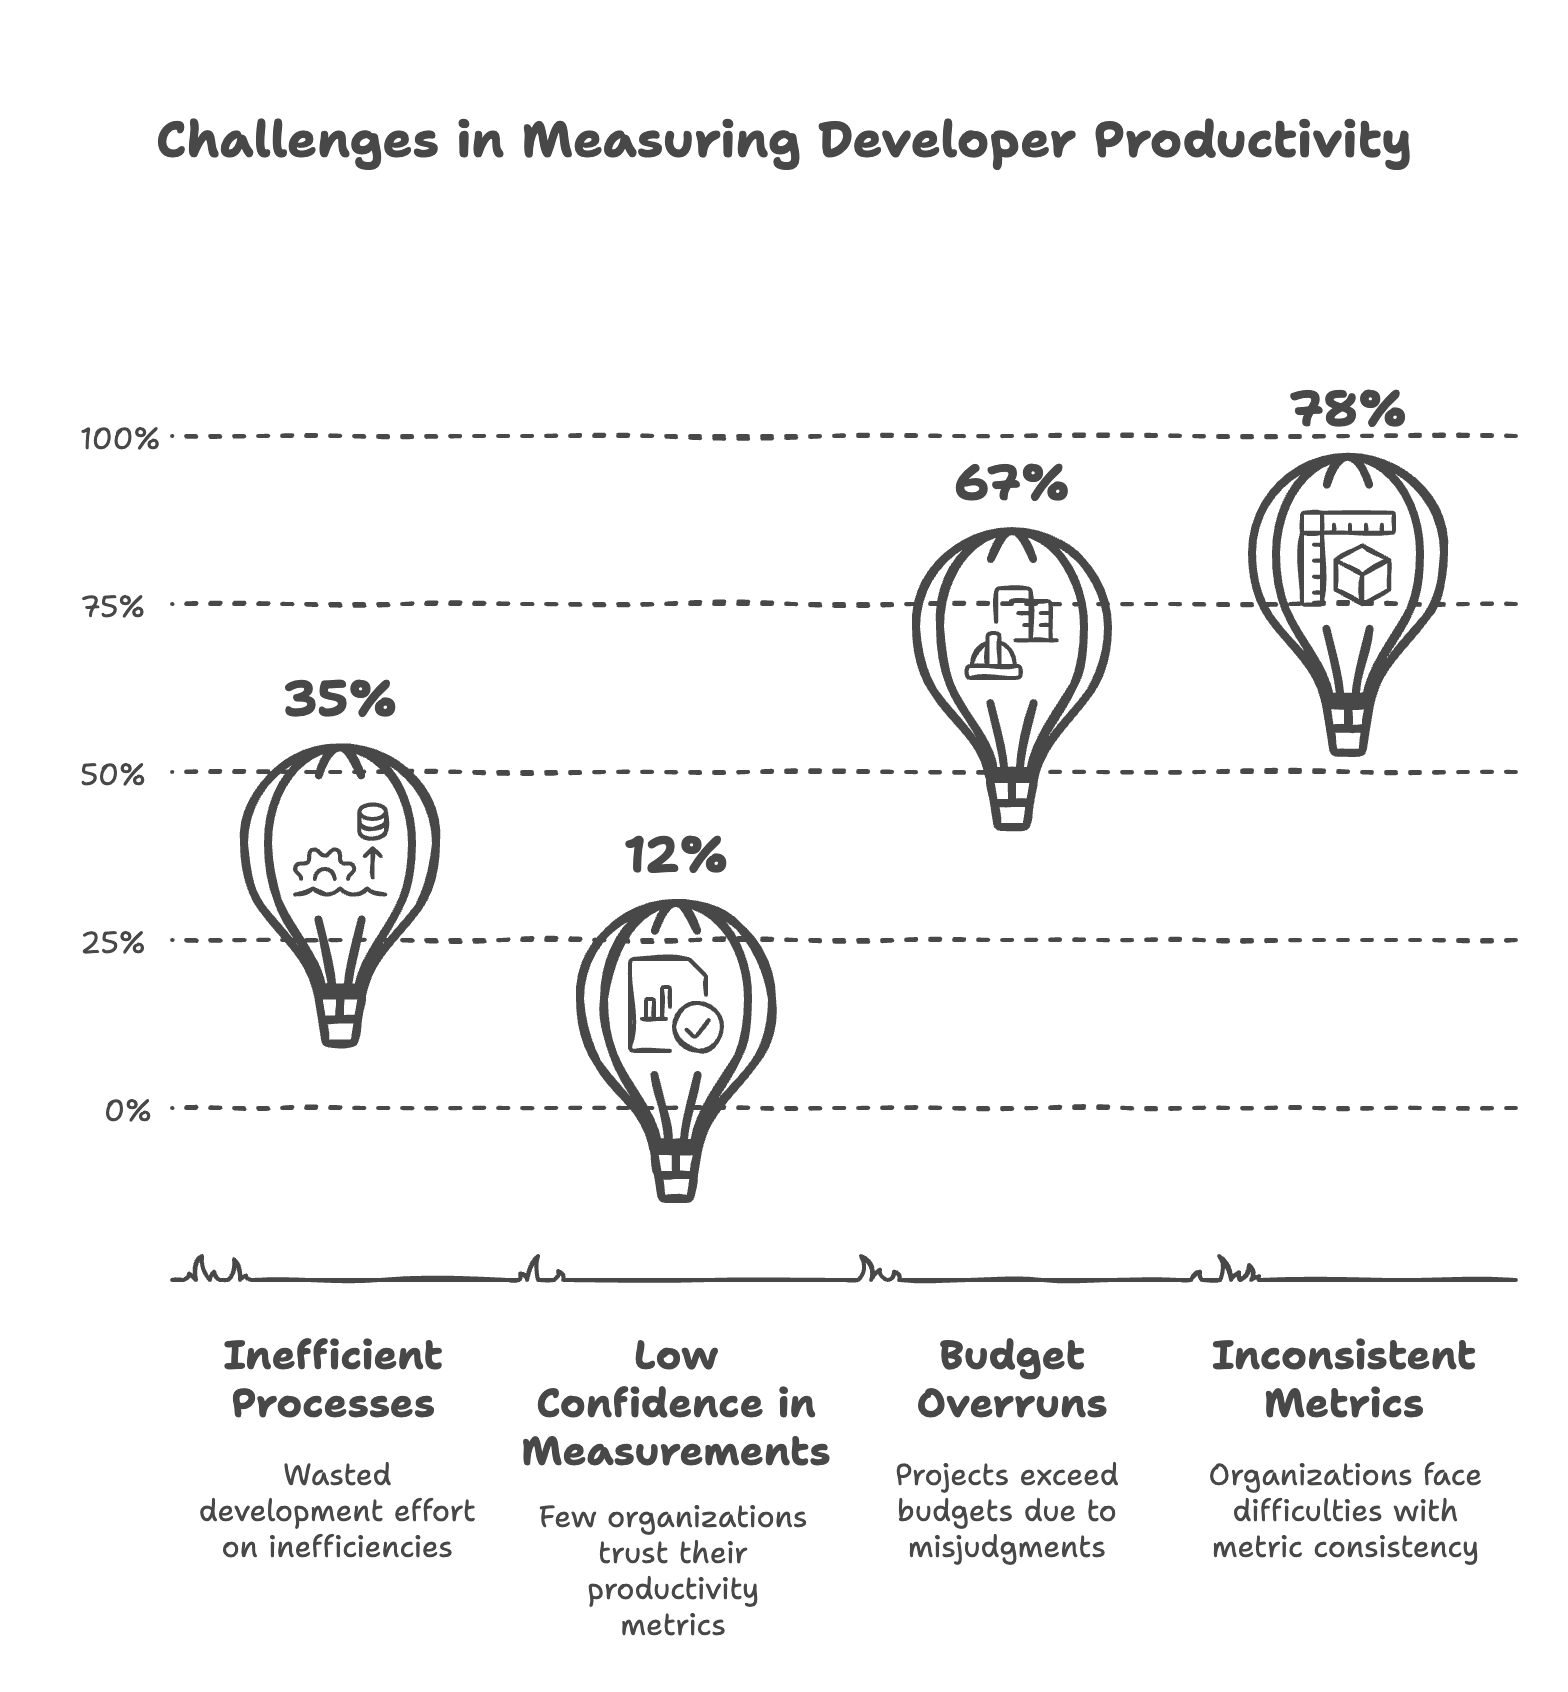
- 35% of development effort is wasted on inefficient processes
- Only 12% of organizations report high confidence in their productivity measurements
- 67% of software projects exceed their budgets due to productivity misjudgments
- 78% of organizations struggle with inconsistent productivity metrics
In this blog post we will try to address these challenges by:
- Examining four proven approaches to measuring productivity
- Providing data-driven metrics from industry leaders
- Sharing real-world implementation examples
- Offering practical frameworks for measurement
The Measurement Challenge
Current State of Industry
Recent research from the 2023 State of DevOps Report reveals a complex landscape:
- 63% of organizations struggle with meaningful productivity definitions
- 78% use multiple measurement frameworks
- Only 12% have high confidence in their measurements
- 89% want to improve their measurement approach
Why Traditional Metrics Fail
1. Intangible Output
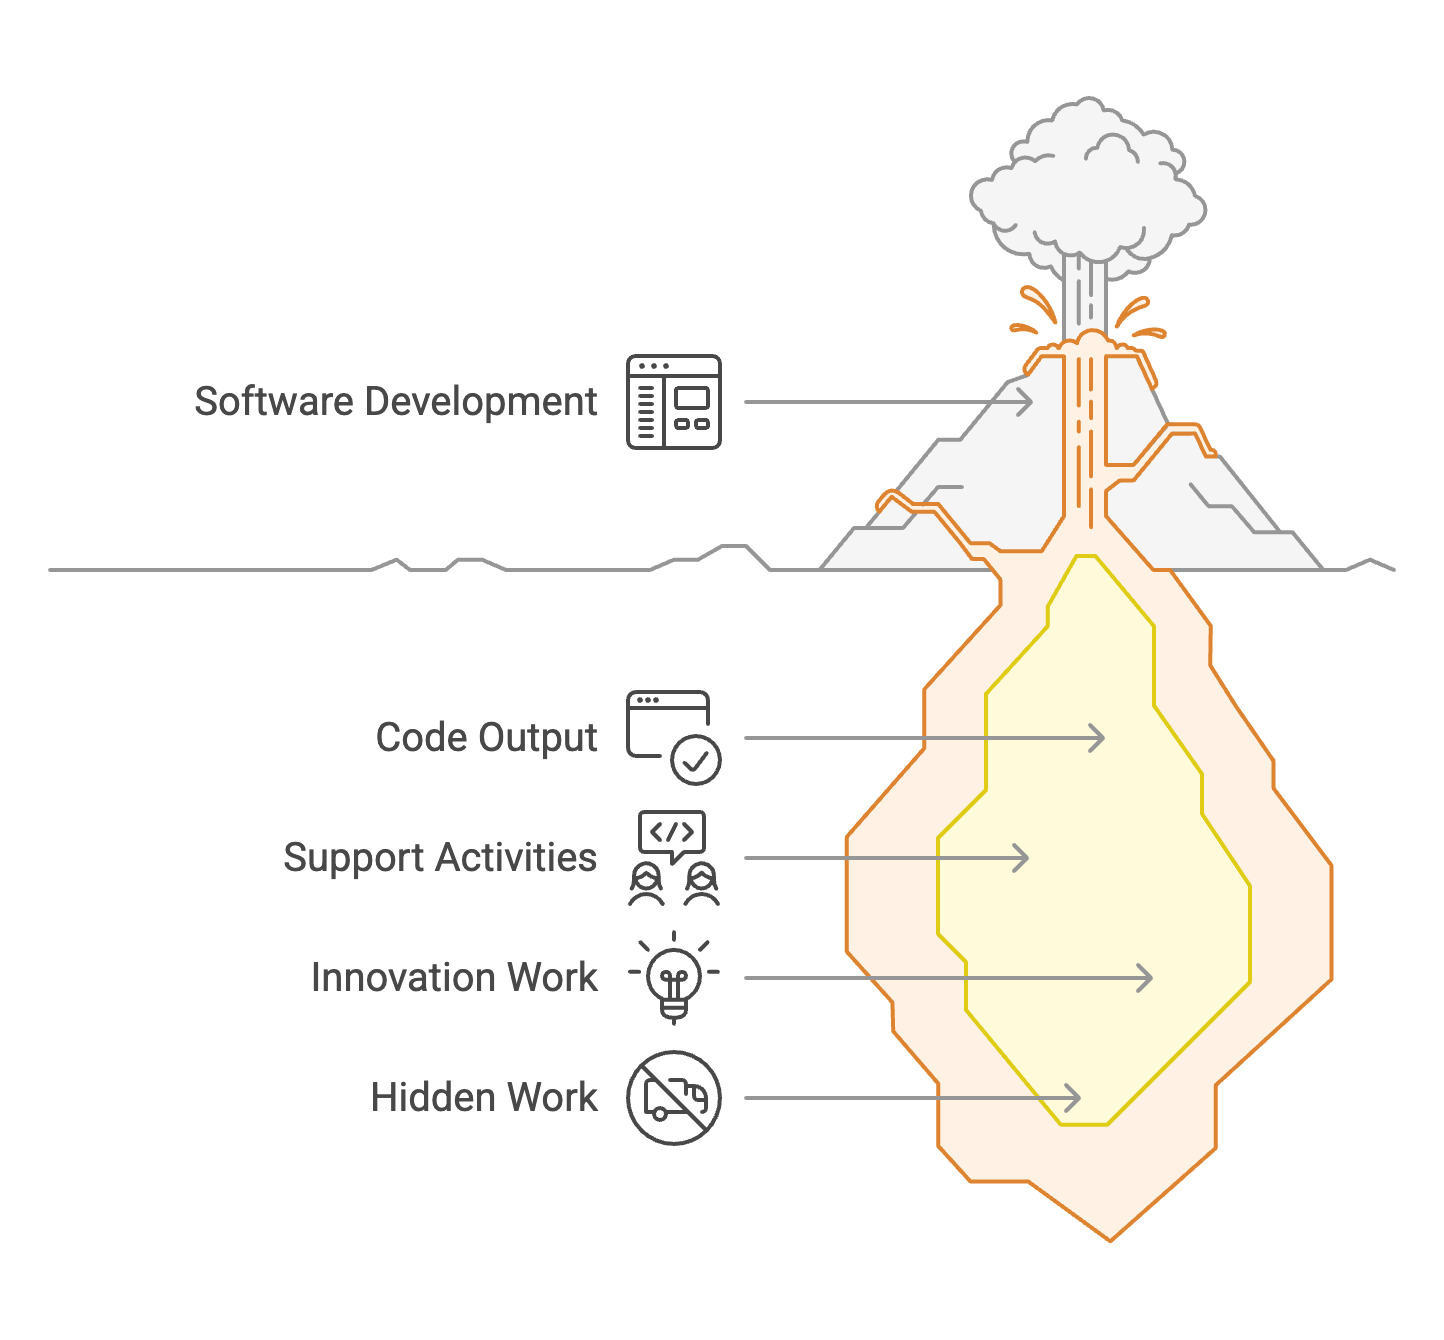
- 82% of development work isn't directly visible in code - as there are many crucial activities like architecture planning, code review, debugging, refactoring, and technical documentation. While these don't always result in new lines of code, they're essential for maintaining and improving software quality.
- 30-45% of developer time goes to support activities - this time is spent on support activities encompasses tasks like mentoring junior developers, participating in knowledge-sharing sessions, helping with technical decisions across teams, addressing production issues, and attending strategic planning meetings. Though these activities don't produce direct code output, they're vital for team effectiveness and project success.
- Innovation work often has no immediate measurable output - which includes research spikes, proof-of-concepts, exploring new technologies, and experimental features that may not make it to production. While these efforts might not show immediate results, they're crucial for long-term technological advancement and keeping the product competitive. For example, a team might spend weeks researching a new database technology that ultimately isn't adopted, but the knowledge gained influences future architectural decisions.
Real-world Example: Netflix's Innovation Sprint
Netflix's UI team spent six weeks exploring new interface concepts. Traditional metrics showed zero productivity (no production code), yet the work led to:
- 18% increase in user engagement
- 12% reduction in churn
- $45M annual revenue impact
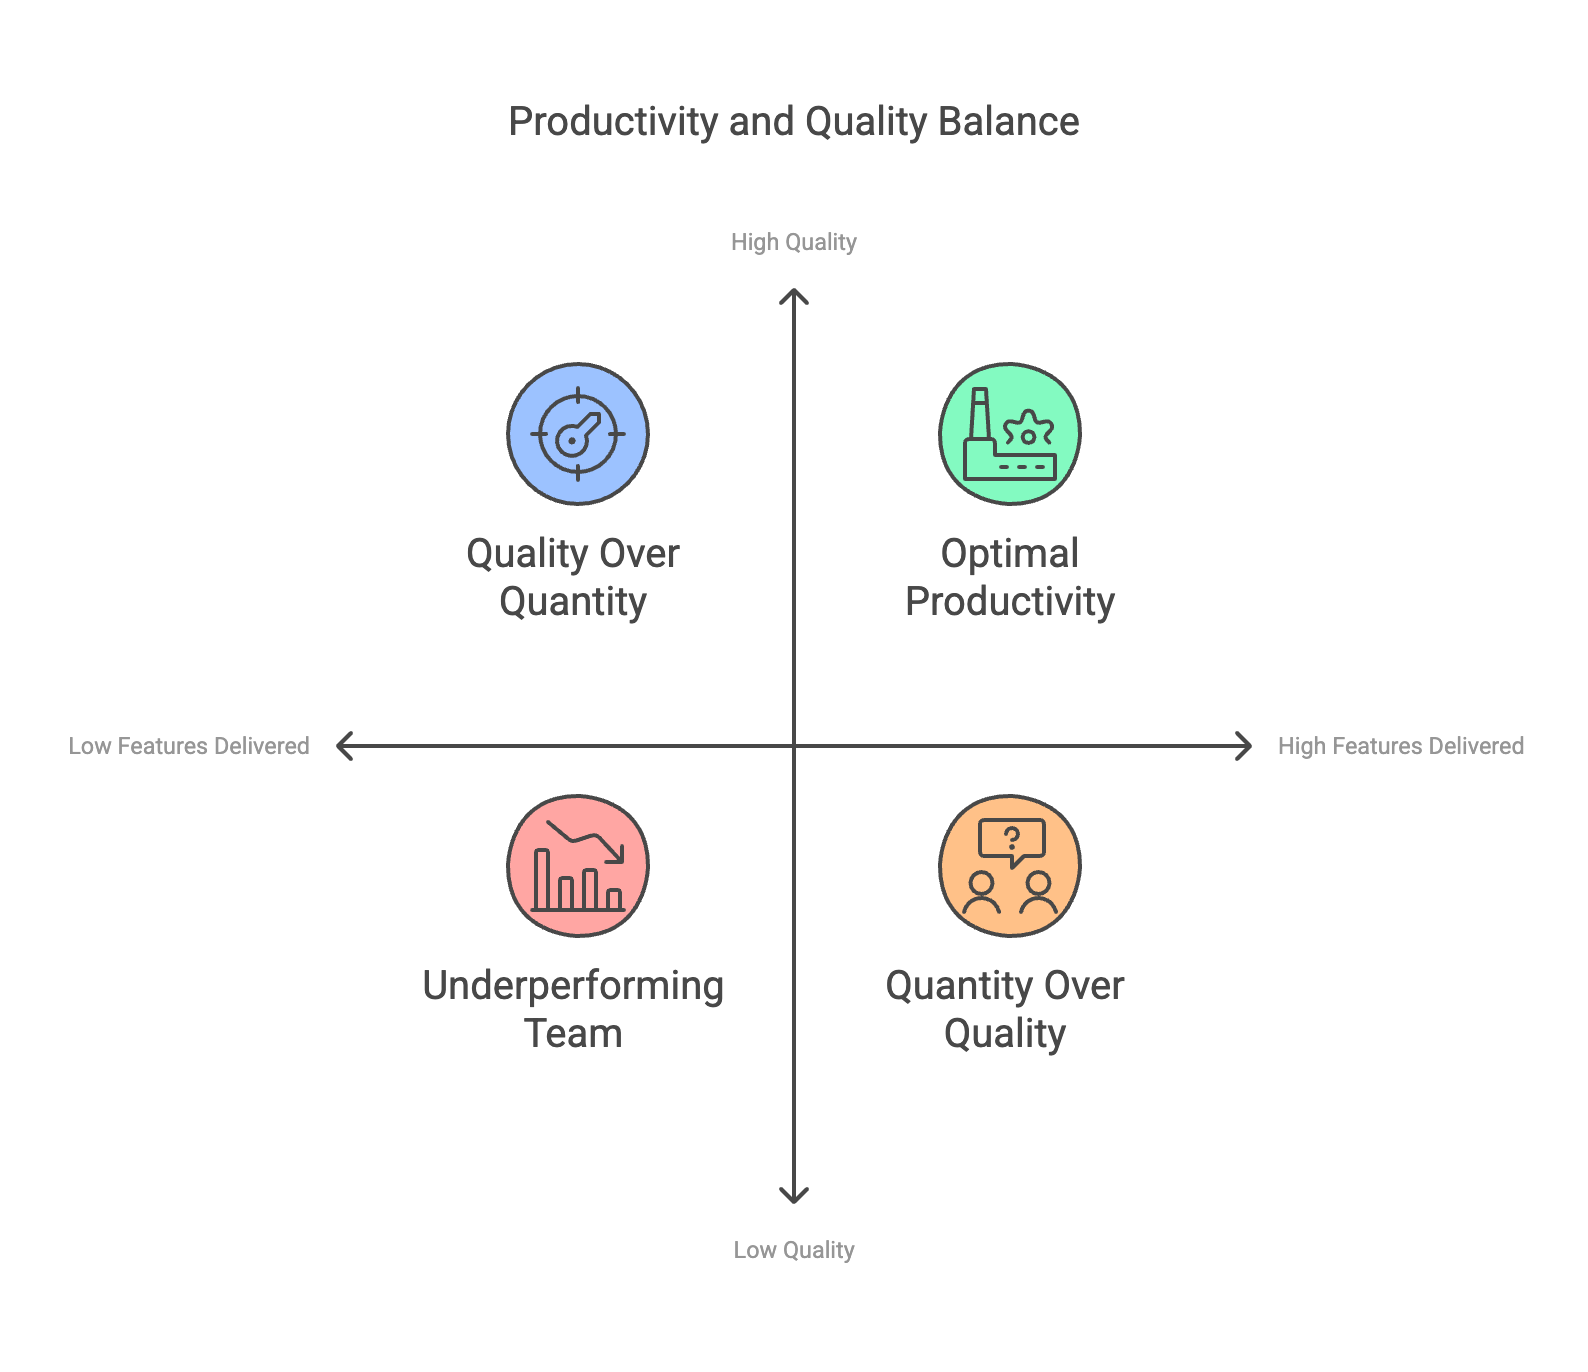
2. Quality-Quantity Balance
- 45% of bugs originate from rushed development - this highlights a critical issue where time pressure leads to shortcuts, inadequate testing, and incomplete requirements analysis. This often results in technical debt and defects that could have been prevented with proper development time. For example, skipping code reviews or proper error handling to meet tight deadlines frequently leads to production issues.
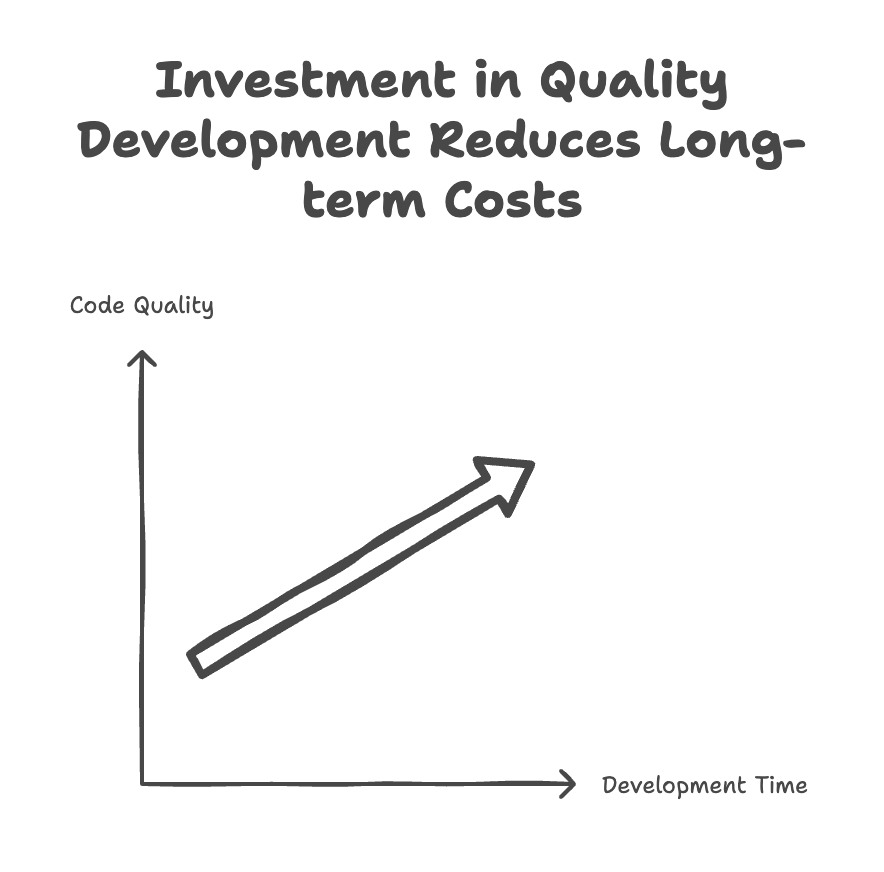
- High-quality code takes 20-30% longer to write initially - high-quality code reflects the investment needed for proper architecture, comprehensive testing, thorough documentation, and robust error handling. While this might seem like a slowdown, it's actually an investment that pays dividends through fewer bugs, easier maintenance, and better scalability. This includes time spent on writing unit tests, performing code reviews, and implementing proper design patterns.
- Well-maintained code costs 40-80% less over time - it demonstrates the significant return on investment from quality-focused development. Clean, well-documented, and properly structured code is easier to understand, modify, and debug. This translates to faster feature additions, quicker bug fixes, and reduced onboarding time for new team members. For instance, a project that invested in good test coverage and clean architecture might take 3 months instead of 2 to complete initially, but saves hundreds of hours in maintenance and bug fixing over the next few years.
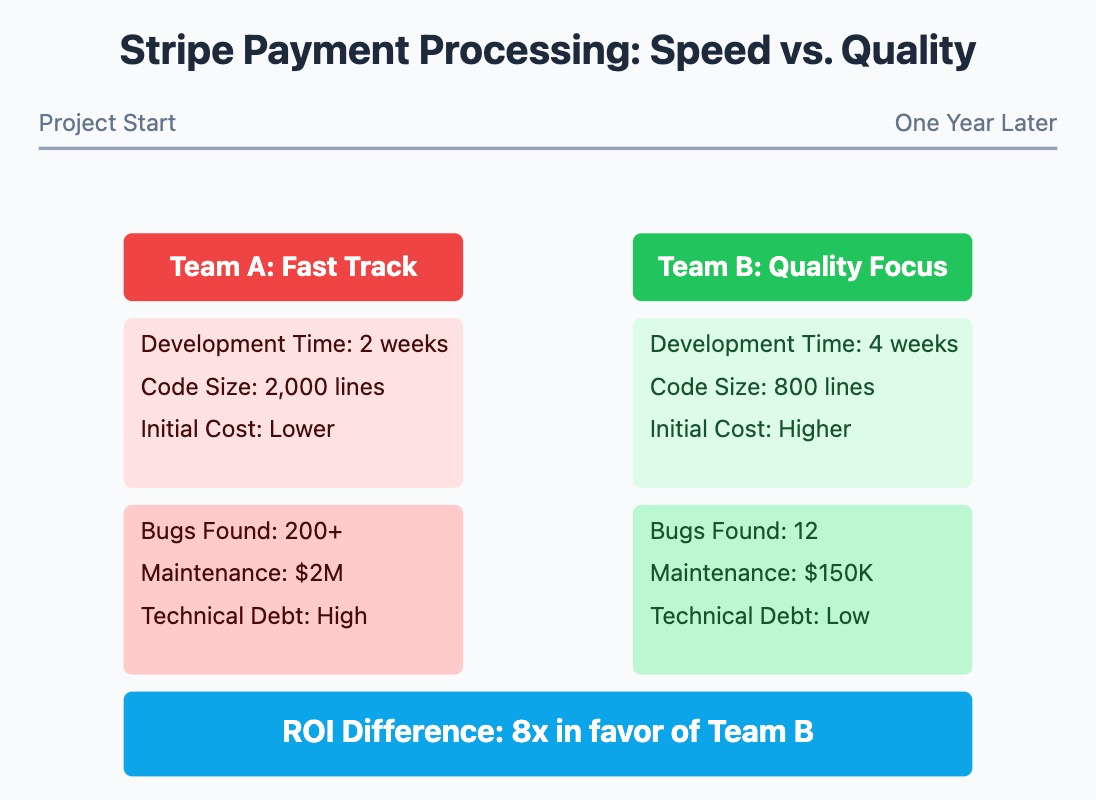
Real-world Example: Stripe's Payment Processing Module
- Team A: Delivered feature in 2 weeks, 2,000 lines of code
- Team B: Delivered similar feature in 4 weeks, 800 lines of code
- One Year Later:
- Team A's code: 200+ bugs, $2M in maintenance costs
- Team B's code: 12 bugs, $150K in maintenance costs
- ROI difference: 8x in favor of Team B
3. Context Sensitivity
- Project type impact: 50-200% variance in metrics - reflects how dramatically different projects require different approaches and measurements. For example, a safety-critical medical device software project might take 3 times longer than a simple web application of similar size due to regulatory requirements, extensive testing, and documentation needs. Similarly, a machine learning project might have very different success metrics compared to a traditional CRUD application.
- Team size effect: 30-60% measurement validity variation - shows how team dynamics significantly impact how we should interpret productivity metrics. A small team of 3-5 developers might have very different velocity measurements compared to a team of 15-20 developers working on the same project. For instance, a story point in a small team might represent much less actual work than in a larger team due to reduced communication overhead and faster decision-making processes.
- Domain complexity: 100-300% effort estimate variation - based on domain complexity illustrates how technical and business domain complexity can dramatically impact project timelines. For example, developing a feature for a simple e-commerce system might take 1 week, while implementing a similar-sized feature in a complex financial trading system could take 3-4 weeks due to additional considerations around regulations, data integrity, and system interactions. This huge variance makes standard industry benchmarks much less meaningful without proper context.
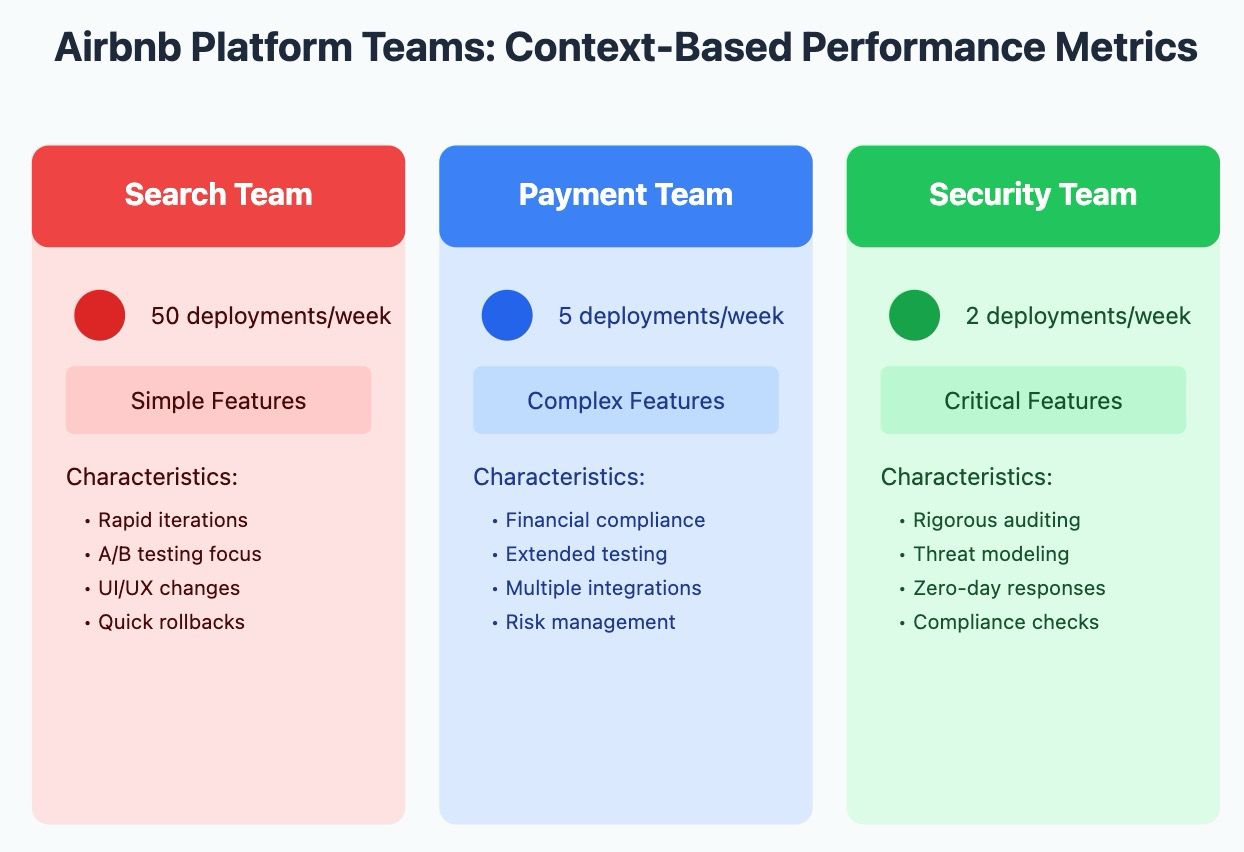
Real-world Example: Airbnb's Platform Teams
- Search Team: 50 deployments/week, simple features
- Payment Team: 5 deployments/week, complex features
- Security Team: 2 deployments/week, critical features
Result: Each team required different productivity metrics based on their context
The above presents a compelling narrative about the true value of quality in software development and its impact on long-term success. These findings suggest that organizations would benefit from shifting their focus from immediate delivery speed to long-term code quality and maintainability. While this approach might appear slower at first, it consistently delivers superior business value through reduced maintenance costs, fewer defects, and better user outcomes.
This also means that Quality metrics are really important when it comes to productivity metrics and measurements. Some examples of quality metrics are Bug Resolution Time, Defect Density, Technical Debt Ratio, User-Reported Issues and etc.
Four Modern Approaches to Productivity
1. Economic Approach
Conceptual Formula:
Productivity = Output Value / Input Cost
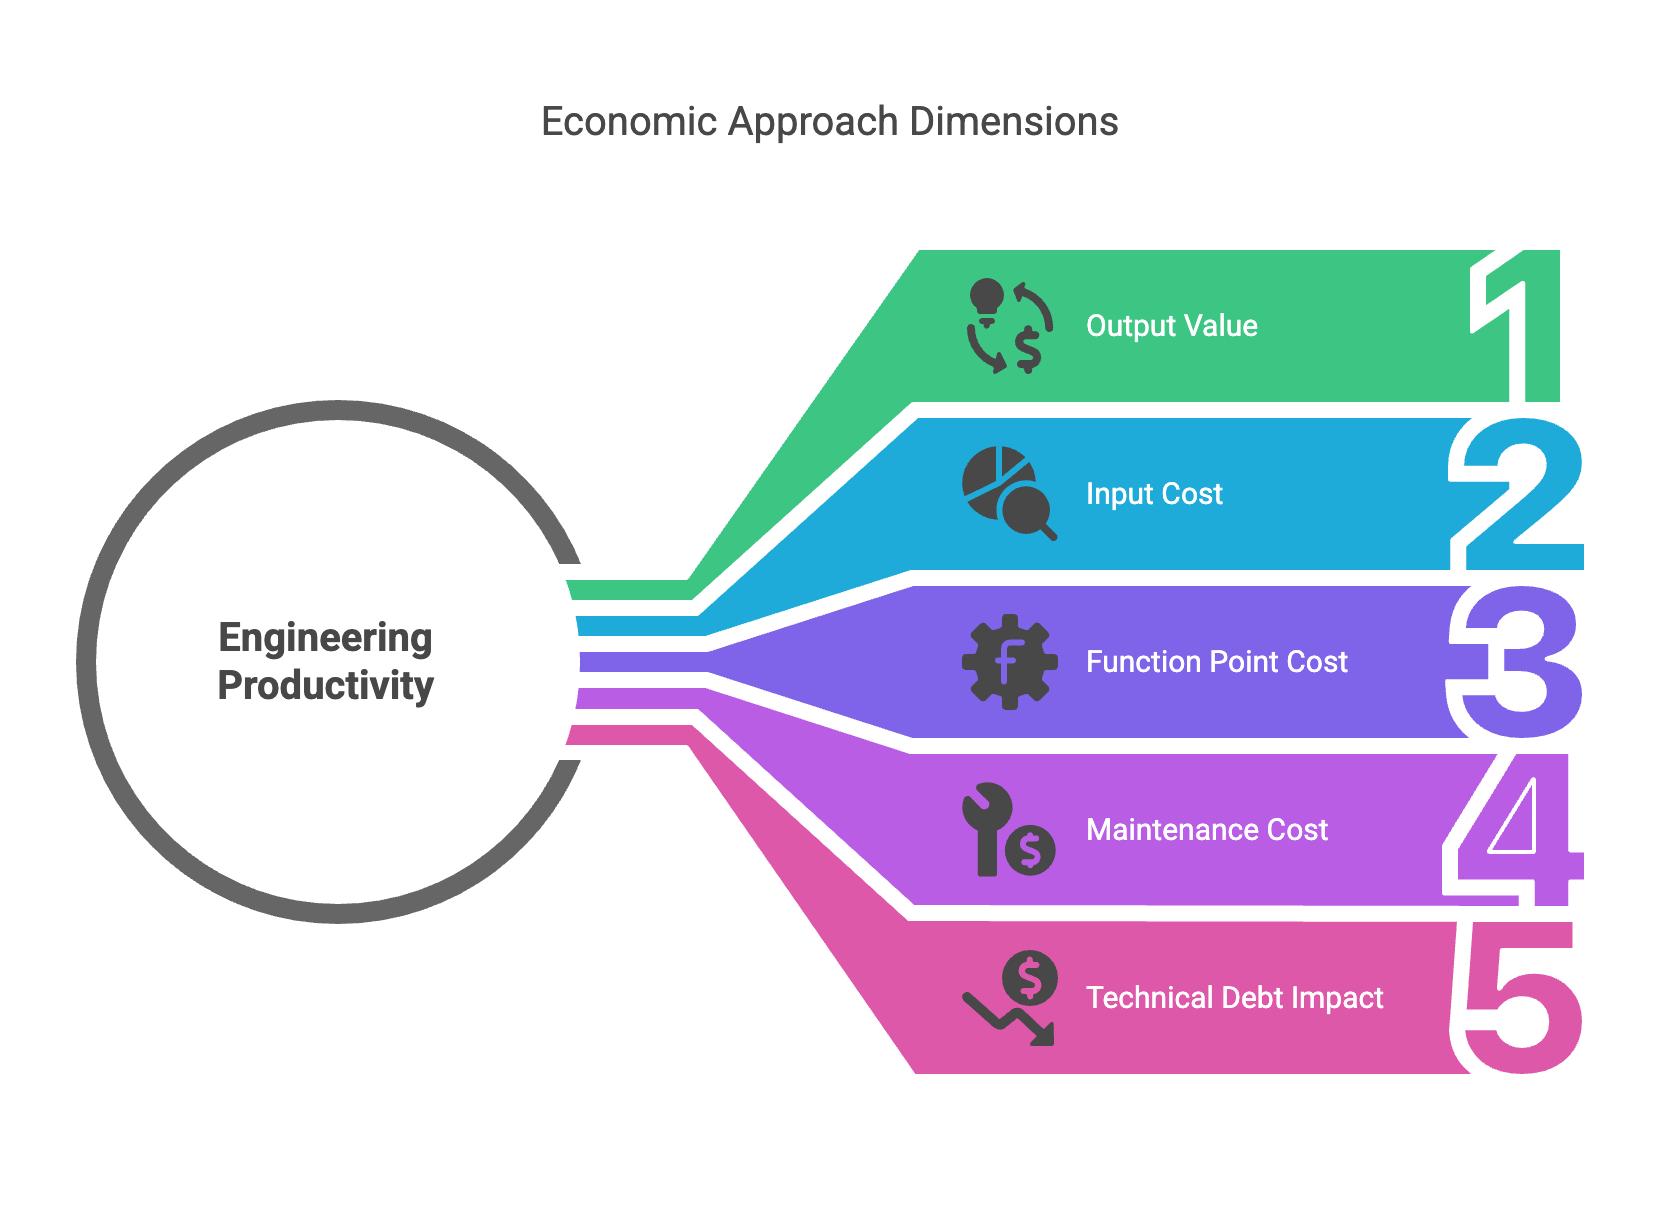
This represents the economic view of engineering productivity:
- Output Value: Measures the business value created through software development (revenue generated, cost savings, improved efficiency)
- Input Cost: Includes direct costs (salaries, tools, infrastructure) and indirect costs (training, overhead, coordination)
- This formula helps organizations understand the return on their engineering investments
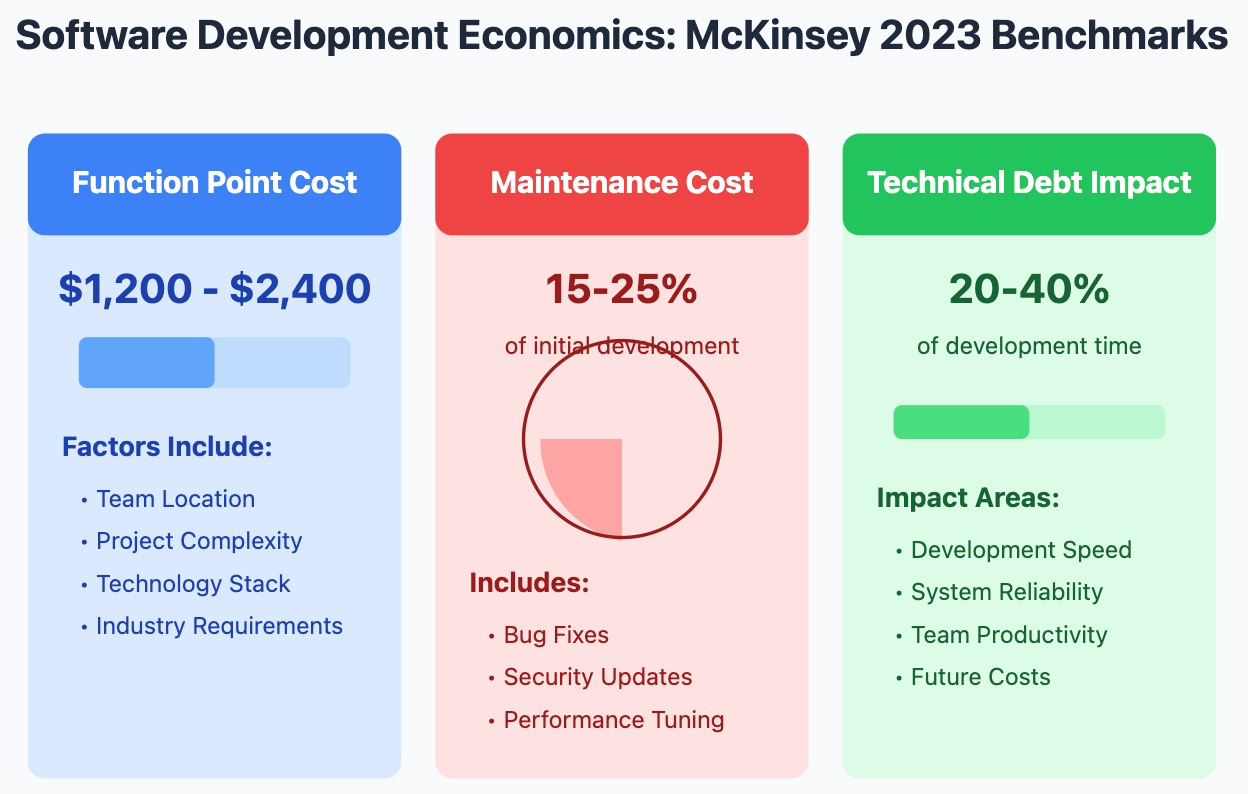
Industry Benchmarks Overview:
a. Function Point Cost
- Measures the cost to deliver a standardized unit of software functionality
- Helps compare development costs across different projects and organizations
- Varies significantly based on:
- Team location and expertise
- Project complexity
- Technology stack
- Industry requirements
b. Maintenance Cost
- Represents ongoing costs after initial development, also can be referenced as KTLO (Keep The Lights On)
- Includes:
- Bug fixes
- Security updates
- Performance optimization
- Platform upgrades
- Critical for understanding total cost of ownership (TCO)
c. Technical Debt Impact
- Measures productivity loss due to suboptimal technical decisions
- Affects:
- Development velocity
- System reliability
- Team morale
- Future enhancement costs
- Becomes more significant as systems age and grow
Real-world Case Study: Spotify's Player Team
Initial Development:
- 6 developers, 3 months
- Cost: $450,000
- Feature: New audio processing algorithm
Traditional Metrics Showed:
- On budget
- On time
- All features delivered
Value-Based Analysis Revealed:
- 30% reduction in bandwidth costs
- 15% improvement in audio quality
- 8% increase in premium subscriptions
- Annual value: $28M
ROI Analysis:
- Traditional view: Project met targets
- Economic view: 62x return on investment
2. Engineering Approach
Conceptual Formula:
Productivity = Features Delivered / Time Period
This represents a simplified view of engineering productivity, but it's important to understand its nuances:
- Features Delivered: Includes not just new features, but also bug fixes, improvements, and technical debt reduction
- Time Period: Can be measured in various units (sprints, quarters, months) depending on the organization's needs
- This basic formula serves as a starting point but needs context-specific adjustments
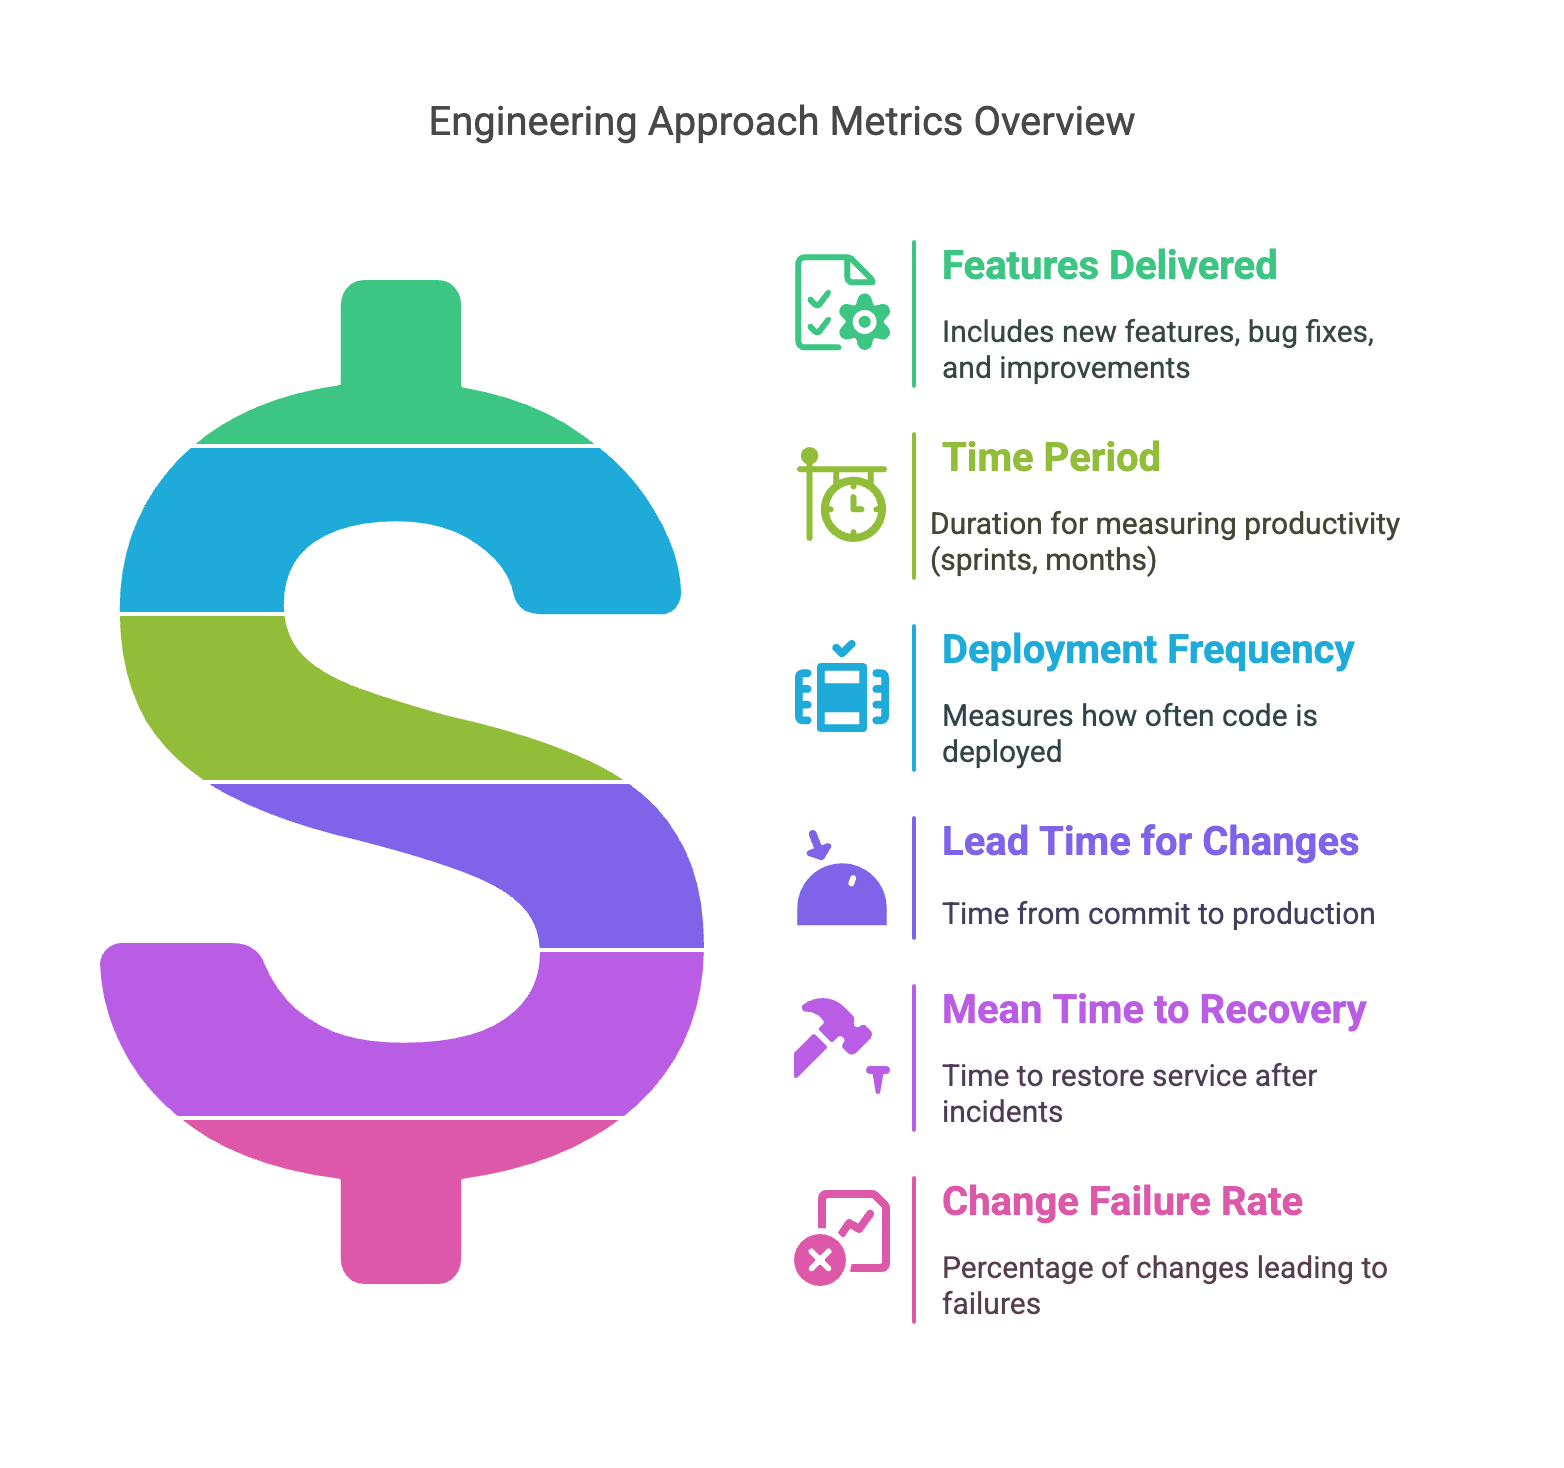
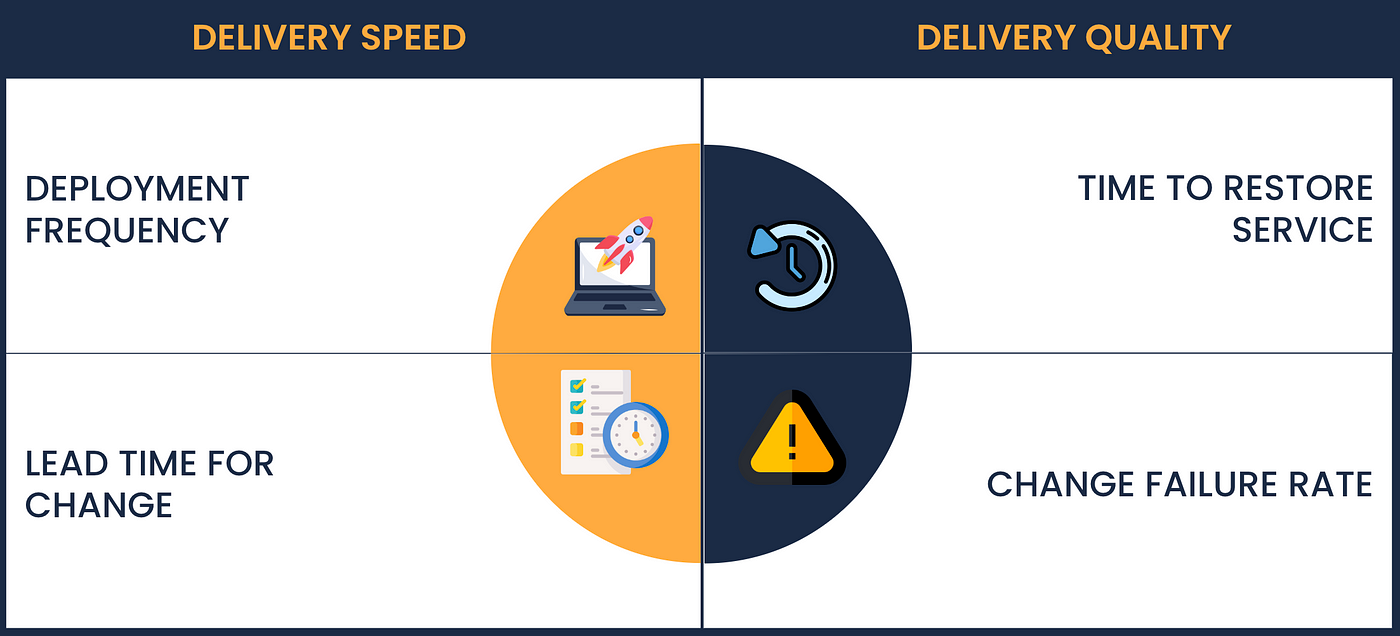
DORA Metrics
DORA (DevOps Research and Assessment) Metrics provide a comprehensive framework for measuring software delivery performance.
There are 4 metrics in the DORA framework:
1. Deployment Frequency
- Measures how often code is deployed to production
- Indicates teams ability to deliver small batches frequently
- Higher frequency generally suggests better continuous delivery practices
2. Lead Time for Changes
- Time from code commit to code running in production
- Reflects efficiency of development and deployment pipeline
- Shorter lead times indicate more efficient processes
3. Mean Time to Recovery (MTTR)
- Time to restore service after an incident
- Measures operational stability and incident response effectiveness
- Reflects teams ability to handle and resolve problems
4. Change Failure Rate
- Percentage of changes that lead to failures in production
- Indicates reliability of deployment processes
- Lower rates suggest better testing and quality control
Real-world Case Study: Shopify's Black Friday Preparation
Team A (Feature-Focused):
- Delivered 15 new features in Q3
- Metrics looked strong
- Seemed highly productive
Team B (Engineering-Focused):
- Delivered 5 new features in Q3
- Focused on scalability
- Seemed less productive
Black Friday Results:
- Team A's features: 60% required hotfixes
- Team B's features: 0% required hotfixes
- System stability: Team B's work prevented $2M in lost sales

Lesson Learned:
- Raw feature count misled management
- Engineering quality metrics proved more valuable
- Changed the company productivity measurement approach
3. Quality-Focused Approach
Conceptual Formula:
Productivity = (Features Delivered × Quality) / Effort
The Quality-Focused Approach to measuring productivity represents a sophisticated way to balance pure output with the robustness and reliability of the code.
The formula interweaves three critical elements: the number of features shipped (raw output), the quality of those features (measured through metrics like test coverage, code complexity, and defect rates), and the effort expended (typically measured in developer hours or story points). By multiplying Features by Quality before dividing by Effort, this approach ensures that teams can't inflate their productivity scores by simply rushing out low-quality code.
For example, if a team delivers 10 features with 90% quality score in 100 hours, they would score higher (0.09) than a team that rushes out 15 features at 60% quality in the same time (0.09 vs 0.06). This calculation method actively discourages technical debt and rewards teams for investing in robust architecture, comprehensive testing, and maintainable code.
Industry Standards:
- Code coverage threshold: > 80%
- Cyclomatic complexity limit: < 15
- Technical debt ceiling: < 5%
- Code duplication maximum: < 3%
Real-world Case Study: Square's Payment Processing
As shown in the Square case study bellow, this approach might appear to slow down initial development but often leads to dramatically lower maintenance costs and better business outcomes over time. Their quality-focused team spent 60% more time upfront but ultimately saved $2.4M compared to the speed-focused team due to fewer incidents and lower maintenance needs.
Initial Approach (Speed-Focused):
- 10 developers
- 3-month timeline
- Goal: New payment processing system
Team Split Test:
- Group A: Feature-first approach
- Delivered in 2.5 months
- Met all feature requirements
- Minimal testing infrastructure
- Group B: Quality-first approach
- Delivered in 4 months
- Built a comprehensive test suite
- Implemented monitoring systems
Six-Month Comparison:
- Group A's System:
- 99.1% uptime
- 150+ production incidents
- $2.5M in lost transactions
- 4 engineers dedicated to maintenance
- Group B's System:
- 99.99% uptime
- 3 production incidents
- Zero lost transactions
- 0.5 engineers for maintenance
Financial Impact:
- Group A: $4.2M total cost
- Group B: $1.8M total cost
- Quality-focused approach saved $2.4M

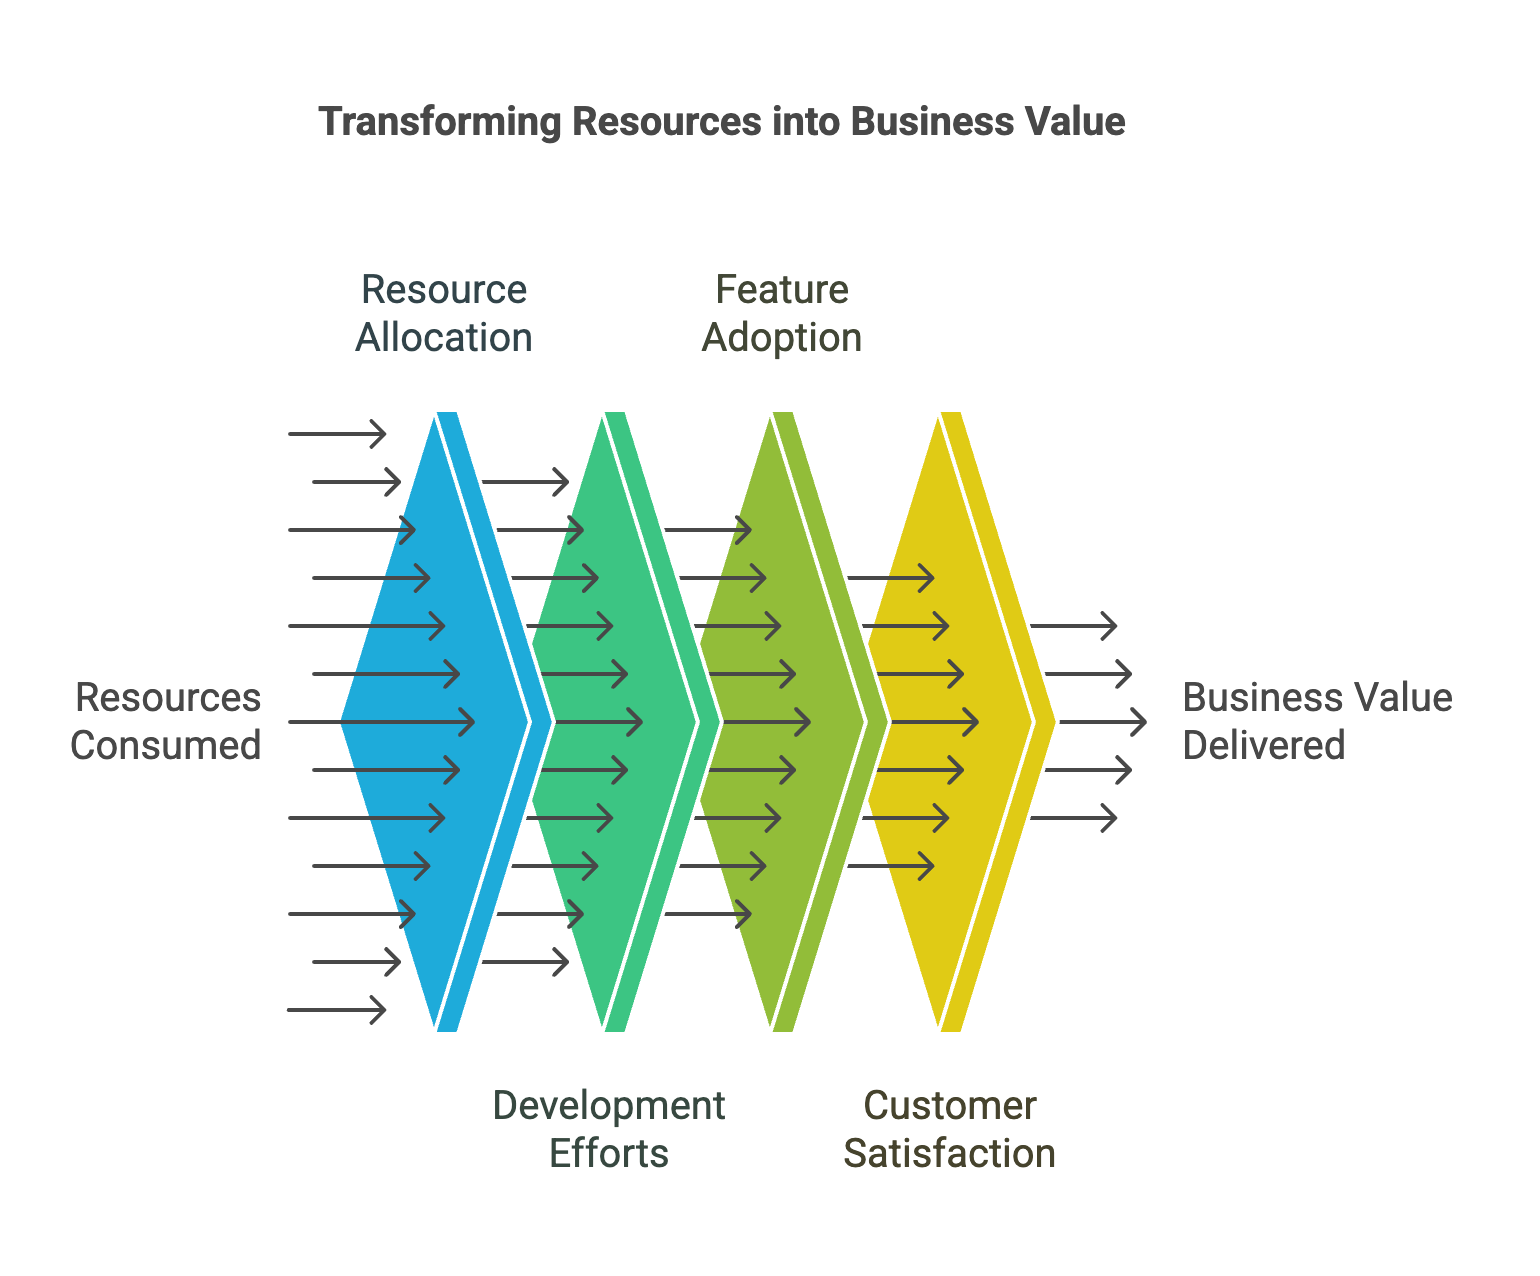
4. Value-Stream Approach
Conceptual Formula:
Productivity = Business Value Delivered / Resources Consumed
The Value-Stream Approach represents a more holistic and business-oriented way to measure productivity by directly linking development efforts to tangible business outcomes. Instead of focusing purely on technical metrics, this approach measures productivity by examining how efficiently teams convert their resources (time, money, developer effort) into actual business value (revenue, user engagement, customer satisfaction, market share).
Industry Benchmarks:
- Feature adoption: > 60%
- Customer satisfaction: > 85%
- Per-developer revenue: $500k-$1M
- Innovation percentage: 15-25% of features
Real-world Case Study: Slack's Feature Development
Project: Message Reaction Feature
Traditional Metrics:
- Development time: 2 months
- Team size: 4 developers
- Cost: $200,000
- Features delivered: On target
Value Stream Metrics:
- User engagement: +26%
- Message retention: +15%
- Team collaboration: +22%
- Customer satisfaction: +18%
Business Impact:
- Reduced churn by 5%
- Increased premium conversions by 8%
- Annual revenue impact: $15M
- ROI: 75x investment
This approach is particularly powerful because it helps bridge the gap between technical and business stakeholders. Rather than getting lost in technical metrics that may be meaningless to business leaders (like code coverage or deployment frequency), it focuses on metrics that matter to everyone: actual business outcomes per unit of investment. This makes it easier to justify development investments and helps teams prioritize work that delivers the highest business value rather than just technical excellence.
The Evolution of Productivity Measurement
The software industry has moved far beyond simplistic measures like lines of code or the number of features delivered. Today's most successful organizations recognize that productivity is a multi-faceted concept that requires a sophisticated and nuanced approach to measurement. The most effective organizations have learned to balance multiple perspectives, combining economic, engineering, quality, and value-stream measurements to create a complete picture of their development efficiency.
Key Insights for Organizations
The path to effective productivity measurement begins with accepting its complexity. Organizations must recognize that no single metric or framework can capture the full spectrum of software development productivity. Instead, success lies in developing a comprehensive measurement strategy that accounts for both immediate outputs and long-term value creation.
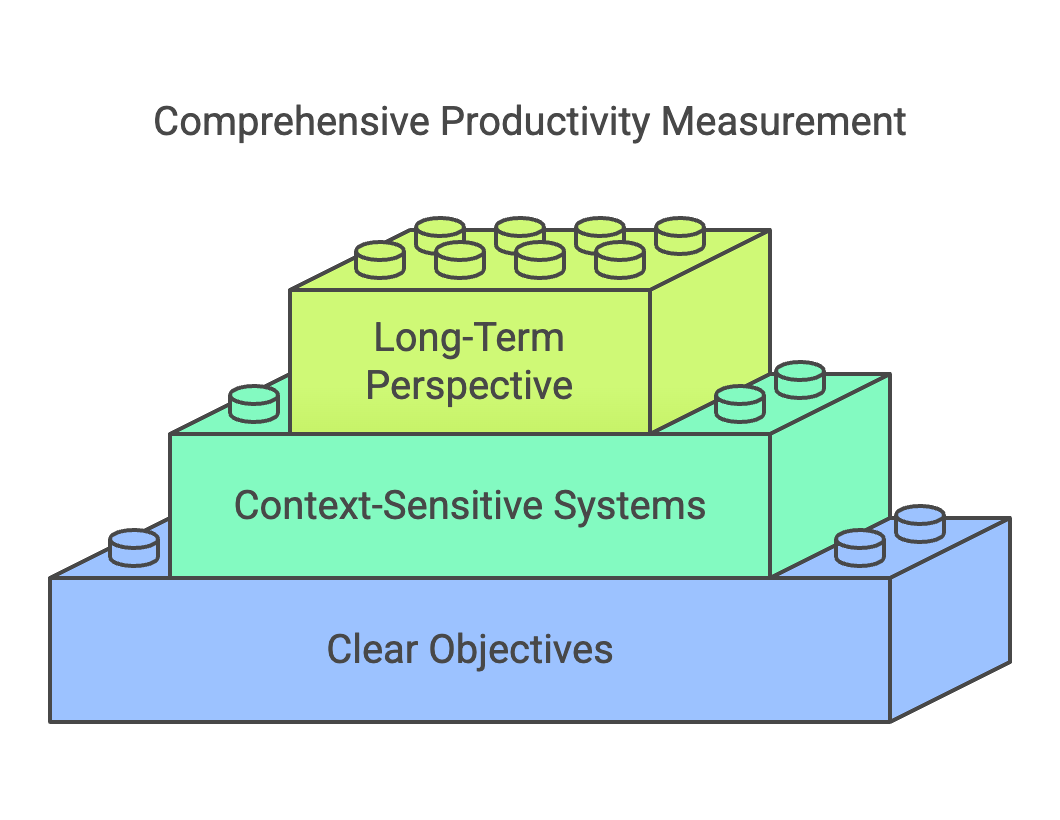
Experience from industry leaders shows that effective productivity measurement requires several foundational elements:
First, organizations must establish clear objectives that align with their business goals. A startup focused on market penetration will need different productivity metrics than an enterprise prioritizing system stability. These objectives should drive the selection and weighting of productivity measurements.
Second, measurement systems must be context-sensitive. What works for one team or project may be inappropriate for another. Organizations need to develop flexible frameworks that can adapt to different development contexts while maintaining consistency in overall evaluation approaches.
Third, successful productivity measurement requires a long-term perspective. While short-term metrics are important for day-to-day management, true productivity improvements often emerge over longer time horizons. Organizations must balance immediate indicators with metrics that capture long-term value creation and sustainability.
Moving Forward: Implementing Effective Measurement
The implementation of productivity measurement systems should be viewed as a journey rather than a destination. Organizations should begin with a clear understanding of their current state and gradually evolve their measurement approaches as they mature. This evolution should be guided by regular feedback and adjustment, ensuring that productivity metrics continue to drive desired behaviors and outcomes.
For organizations beginning this journey, the focus should be on establishing baseline measurements that align with their most critical business objectives. As measurement capabilities mature, additional metrics can be incorporated to provide a more comprehensive view of productivity. Throughout this process, it's essential to maintain focus on metrics that drive real value creation rather than those that are simply easy to measure.
The Road Ahead
Looking to the future, productivity measurement will continue to evolve as new development methodologies emerge and technology landscapes change. Organizations must remain flexible and adaptive in their approach to productivity measurement, ready to incorporate new metrics and methodologies as they prove their value.
The most successful organizations will be those that can balance the competing demands of speed, quality, and value creation while maintaining a sustainable development pace. This requires not just good measurement systems, but also the organizational wisdom to use these measurements effectively in driving continuous improvement.
Final Thoughts
Productivity measurement in software development is not just about tracking metrics – it's about creating an environment where teams can deliver their best work while maintaining a sustainable pace and quality. The most effective productivity measurement systems serve as tools for improvement rather than just evaluation mechanisms.
As the software industry continues to evolve, organizations that can effectively measure and improve their productivity will gain significant competitive advantages. However, this requires moving beyond simple metrics to embrace a more comprehensive and nuanced understanding of what productivity means in the context of software development.
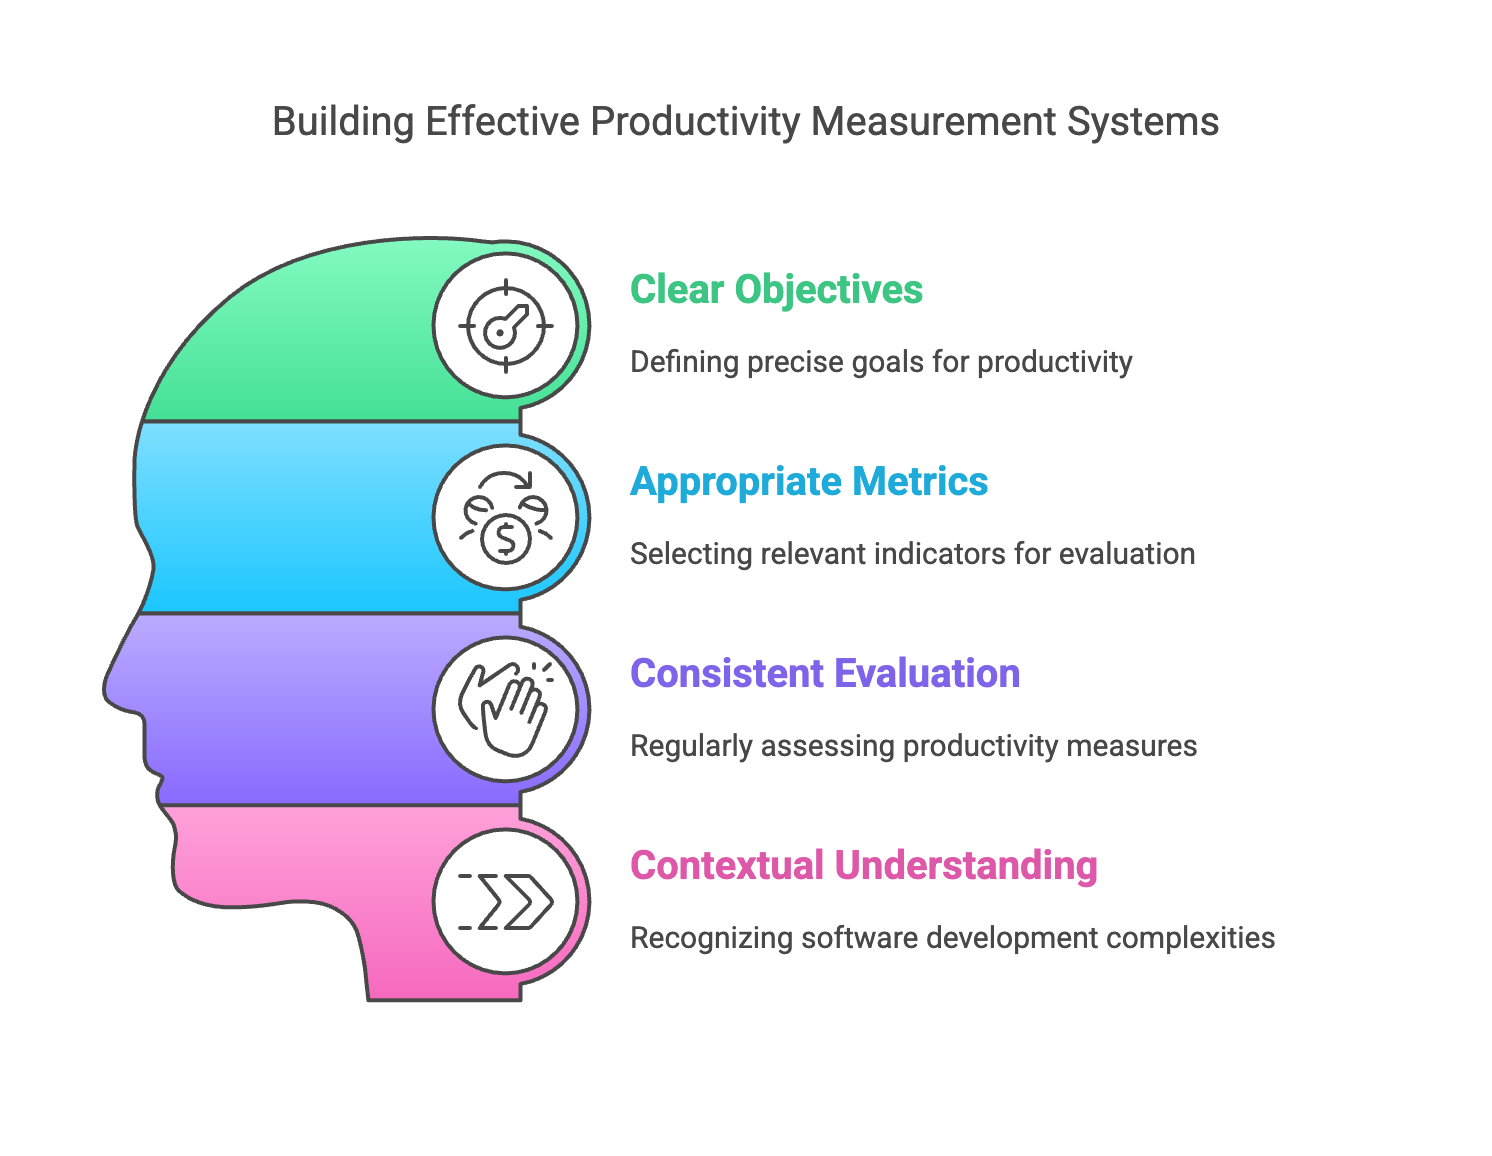
The future belongs to organizations that can successfully navigate these challenges, using sophisticated productivity measurements to drive continuous improvement while maintaining focus on long-term value creation. By combining clear objectives, appropriate metrics, and consistent evaluation with a deep understanding of the complexities involved in software development, organizations can build measurement systems that truly drive improved productivity and business success.
Remember that the goal is not a perfect measurement, but rather a continuous improvement in both the measurement systems and the productivity they track. Success lies in finding the right balance for your organization's specific context while maintaining the flexibility to adapt as circumstances change.


Comments ()