Beyond Lines of Code: A Practical Guide to Measuring Engineering Productivity

Ask ten engineering leaders how they measure productivity and you'll likely get ten different answers, many of them contradictory. Some count commits. Some track story points. Some quietly admit they aren't measuring much at all. The truth is that engineering productivity resists the tidy, single-number scorecards that other business functions often rely on. But that doesn't mean it can't be measured. It means it has to be measured well.
This guide walks through what productivity actually means in software engineering, why the human side matters as much as the metrics, which established frameworks can anchor your approach, and how to start measuring in a way that improves your team rather than gaming it.
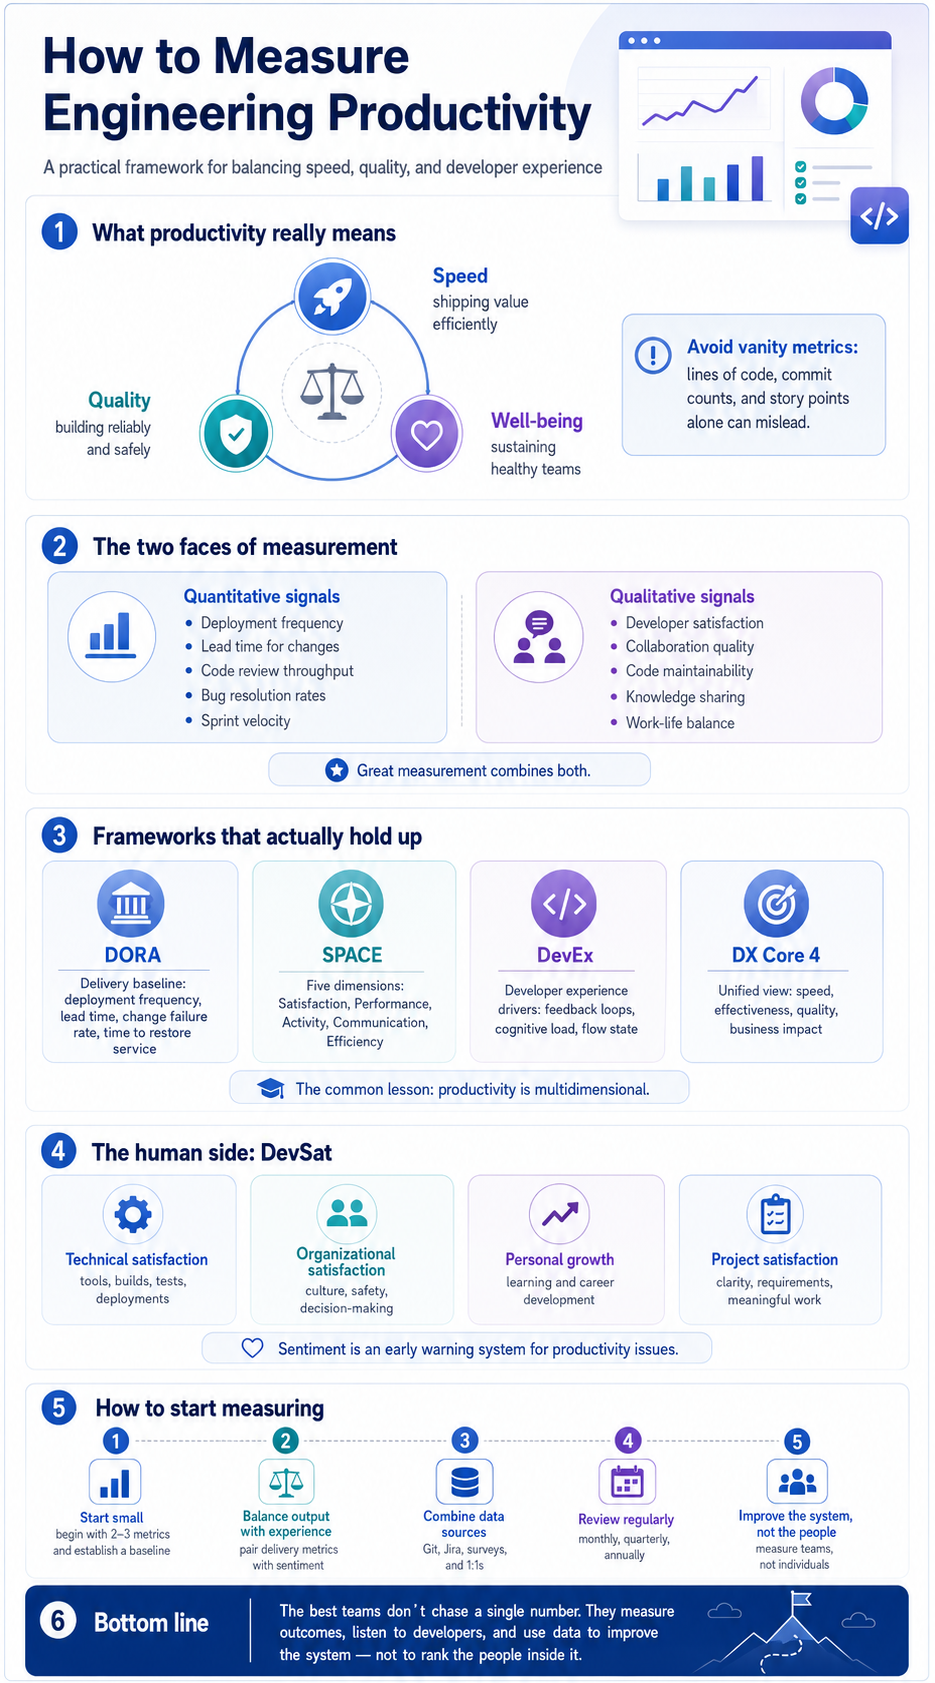
What Productivity Really Means
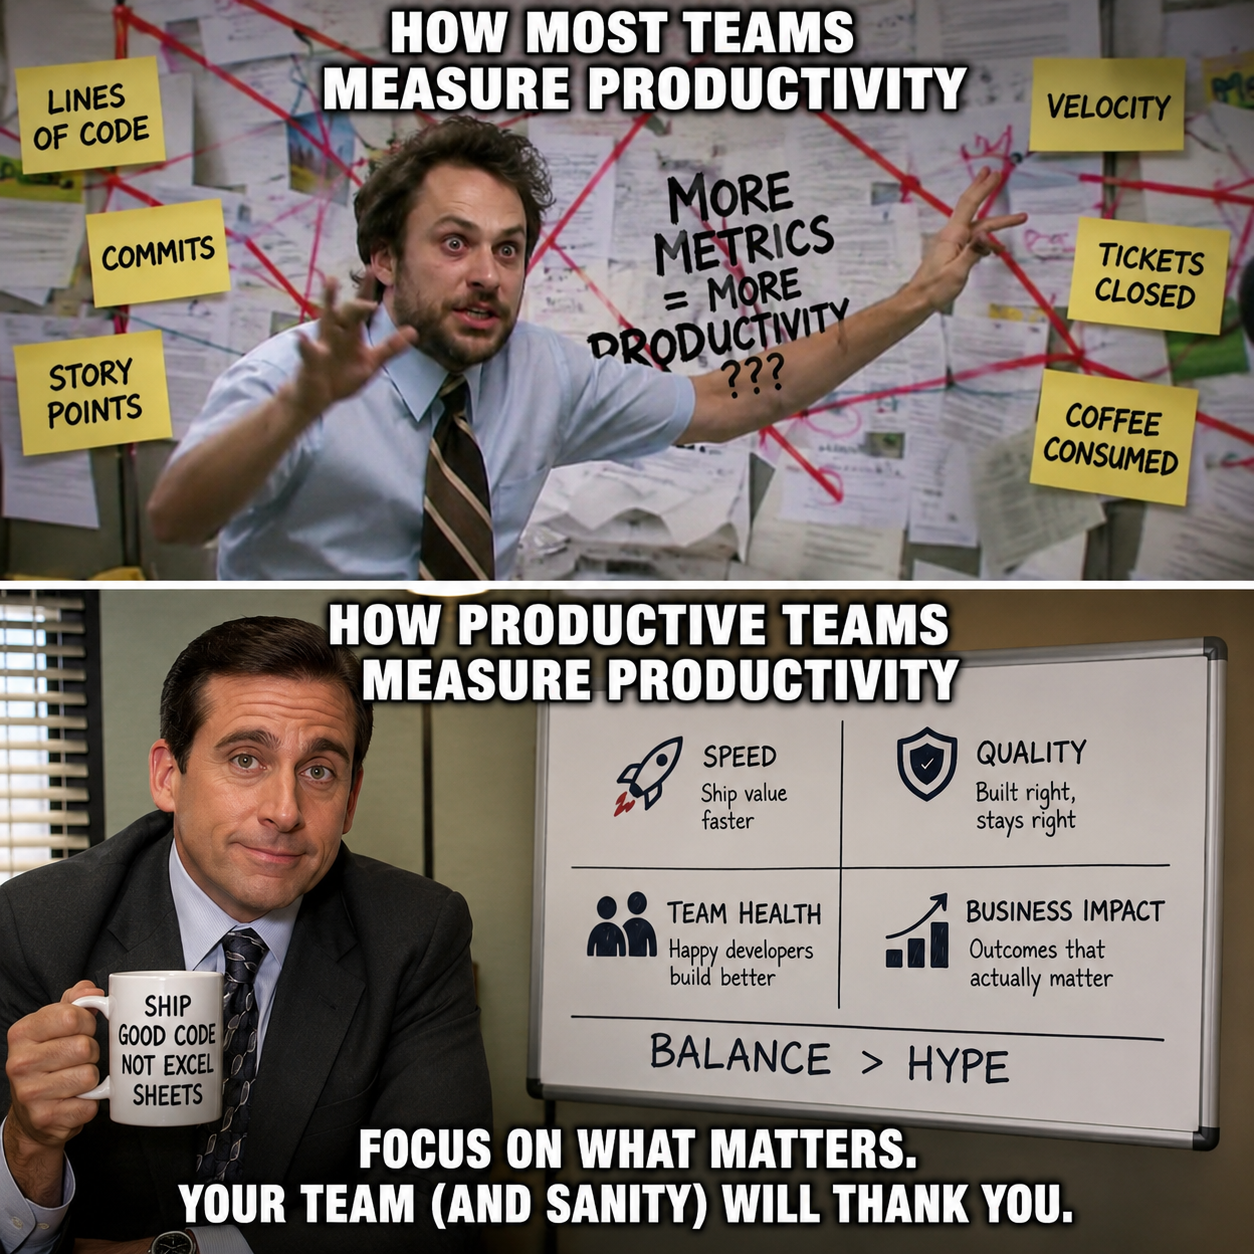
Engineering productivity is far more than lines of code or number of commits. Those figures are easy to collect and easy to inflate, which is exactly why they mislead. A thousand lines of tangled code can be a liability, not an achievement, and a developer who solves a problem by deleting code produces negative output by that measure while creating real value.
This isn't a new insight. Bill Gates is often quoted as saying that measuring programming progress by lines of code is like measuring aircraft building progress by weight. The deeper problem is captured by Goodhart's Law: when a measure becomes a target, it stops being a good measure. Tell a team you're counting commits and you'll get more commits, not more value. Tell them you're tracking story points and velocity will inflate without a single extra feature reaching a user.
Real productivity is about delivering value efficiently while maintaining high code quality and sustainable team health. It sits at the intersection of speed, quality, and well-being, and improving one at the expense of the others rarely holds up over time. A team that ships fast but burns out, or writes flawless code that never reaches users, is not a productive team in any meaningful sense.
That's why any serious approach to measurement has to account for both what can be counted and what can't.
The Two Faces of Measurement
Productivity measurement in software engineering has two distinct components, and neither works alone.
Quantitative metrics give you the observable, trackable signals:
- Deployment frequency: how often you ship to production
- Lead time for changes: how long it takes an idea to reach users
- Code review throughput: how efficiently work moves through review
- Bug resolution rates: how quickly issues get fixed
- Sprint velocity: how much work completes per cycle
Qualitative aspects capture the things numbers can't fully express:
- Developer satisfaction: whether engineers feel good about their work
- Team collaboration quality: how well people work together
- Code maintainability: how easy the codebase is to change safely
- Knowledge sharing effectiveness: how well expertise spreads across the team
- Work-life balance: whether the current pace is sustainable
The mistake most teams make is treating the quantitative side as "real" and the qualitative side as "soft." In practice, the qualitative signals are often leading indicators. They tell you where the numbers are headed before the numbers move.
The Frameworks That Actually Hold Up
You don't have to invent a measurement system from scratch. Over the past decade, a small number of research-backed frameworks have emerged, and they build on each other in a clear lineage. Understanding them saves you from reinventing the wheel or, worse, defaulting back to counting commits.
DORA: The Delivery Baseline
The DevOps Research and Assessment (DORA) program, led by Nicole Forsgren, Jez Humble, and Gene Kim, produced the most widely adopted starting point. Its four keys measure software delivery performance: deployment frequency, lead time for changes, change failure rate, and time to restore service. The research behind these metrics is laid out in the book Accelerate and updated each year in the State of DevOps report. The core finding is that speed and stability are not opposites. Elite teams achieve both together, and delivery performance correlates with organizational outcomes like profitability and market share.
DORA's strength is that it measures outcomes rather than individual output, which sidesteps the worst gaming problems. Its limit is that it says almost nothing about the developer's experience or the day-to-day friction of the work.
SPACE: A Broader Lens
To address that gap, Forsgren teamed up with researchers from GitHub and Microsoft to publish the SPACE framework in 2021. SPACE is not a fixed set of metrics but a set of five dimensions to draw from: Satisfaction and well-being, Performance, Activity, Communication and collaboration, and Efficiency and flow.
The central argument of SPACE is that productivity is multidimensional and cannot be captured by any single metric. The authors are explicit that activity metrics like lines of code or commits, used in isolation, are misleading, and that any healthy measurement program should include at least a satisfaction dimension alongside its output measures.
DevEx and DX Core 4: The Experience Turn
The most recent evolution focuses on developer experience directly. The DevEx framework, published in 2023 by Abi Noda, Margaret-Anne Storey, Nicole Forsgren, and Michaela Greiler, organizes the developer's experience around three drivers: feedback loops (how quickly you get results back), cognitive load (how much you have to hold in your head), and flow state (how often you can work without interruption).
In late 2024, this line of work converged into DX Core 4, a unified approach that folds DORA, SPACE, and DevEx into four dimensions: speed, effectiveness, quality, and business impact. The through-line across all of these, from DORA to DX Core 4, is Nicole Forsgren's research, and the consistent message is that you need a balanced set of measures rather than one number.
The Human Side: Engineering Sentiment
Engineer sentiment is one of the most important drivers of productivity, and one of the least measured. Happy, engaged developers tend to be more productive, more creative, and far more likely to stay. Disengaged ones quietly slow down long before anyone notices it in a dashboard.
The data on how developers currently feel should give leaders pause. In Stack Overflow's 2024 Developer Survey, only around one in five professional developers reported being happy at work, while a much larger share described themselves as unhappy or complacent. Industry surveys on burnout are consistently alarming, with many reporting that a majority of engineers have experienced burnout in the past year. Sentiment, in other words, is not a fringe concern. For most teams it is an active liability.
Academic research supports the intuition that this matters for output. Studies on the link between developer happiness and performance have found that unhappiness among software developers is associated with concrete costs: lower productivity, lower code quality, and a higher tendency to abandon or delay work. Happiness is not a nice-to-have that sits outside the productivity conversation. It is inside it.
Several factors shape sentiment:
- Psychological safety: feeling comfortable taking risks, asking questions, and sharing half-formed ideas without fear. Google's well-known Project Aristotle study of what makes teams effective found psychological safety to be the single most important factor, ahead of individual talent.
- Tool satisfaction: having the right resources and infrastructure to do the work without friction. This maps directly to DevEx's cognitive-load and feedback-loop drivers.
- Career growth: clear, credible paths for professional development.
- Work impact: understanding how the work connects to real company goals.
- Team dynamics: strong, trusting relationships with colleagues.
When these erode, output eventually follows. Sentiment is the early-warning system for productivity problems that haven't surfaced in the metrics yet.
A Cautionary Tale: When Measurement Goes Wrong
It's worth pausing on how badly this can go, because the failure mode is common and instructive. In 2023, McKinsey published a piece proposing a way to measure individual developer productivity. The response from the engineering community was swift and pointed. Kent Beck, one of the original signatories of the Agile Manifesto, co-wrote a widely read two-part rebuttal with Gergely Orosz arguing that the approach misunderstood how software work actually creates value and risked incentivizing exactly the wrong behavior.
The core lesson from that debate is simple and worth internalizing before you build any measurement program: metrics aimed at ranking individuals tend to backfire. They erode trust, invite gaming, and measure activity rather than impact. The frameworks that have held up, from DORA to SPACE to DevEx, deliberately measure teams and systems, not people. If your dashboard's primary use is comparing engineers against each other, you have already taken a wrong turn.
How to Start Measuring, Without Overdoing It
The most common failure mode is trying to measure everything at once. Resist it. Effective measurement starts small and expands deliberately.
1. Start small. Pick two or three key metrics to track initially. A sensible starting point for most teams is the DORA four keys, because they are outcome-focused and hard to game. Establish baselines for your current performance so you know where you actually stand, then set realistic improvement goals. A handful of well-understood metrics beats a dashboard nobody trusts.
2. Balance output with experience. Following SPACE, never track delivery metrics alone. Pair every "how fast and how much" metric with at least one "how does it feel" measure. A rising deployment frequency alongside a falling satisfaction score is not a win. It's a warning.
3. Combine data sources. No single tool tells the whole story. Pull from several:
- Git analytics for delivery and review patterns
- JIRA or project-management metrics for flow and throughput
- Regular developer surveys for sentiment and experience
- 1:1 feedback sessions for the context numbers miss
The best programs deliberately triangulate between system data (what the tools record), self-reported data (how developers describe their experience), and qualitative data (what surfaces in conversation). Any one source in isolation gives a distorted picture.
4. Establish regular review cycles. Measurement only helps if you act on it. Build a cadence:
- Monthly metric reviews to catch short-term shifts
- Quarterly trend analysis to see the real direction of travel
- Annual comprehensive assessments to evaluate the bigger picture
5. Measure to improve, not to judge. State plainly, and repeatedly, that the goal is to improve the system rather than rank the people inside it. The moment engineers suspect a metric will be used against them individually, its data becomes worthless, because they will optimize for the number instead of the outcome. Psychological safety and honest measurement rise and fall together.
The goal isn't to accumulate data. It's to build a feedback loop your team believes in and responds to.
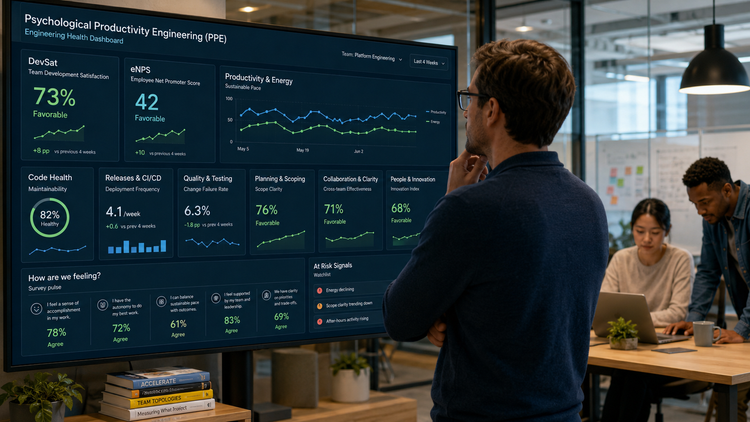
DevSat: Making Developer Satisfaction a First-Class Metric
If sentiment matters this much, it deserves to be tracked with the same rigor as deployment frequency. That's the idea behind DevSat (Developer Satisfaction), a structured measure of how engineers actually experience their work. It operationalizes the "Satisfaction" dimension of SPACE and the drivers of DevEx into something you can survey, trend, and act on.
DevSat typically spans four dimensions:
- Technical satisfaction: the quality of development tools and processes. Slow builds, flaky tests, and painful deployments show up here, and they map directly to DevEx's feedback-loop and cognitive-load drivers.
- Organizational satisfaction: company culture and work environment, including psychological safety and how decisions get made.
- Personal growth: learning opportunities and career advancement, and whether engineers feel they are getting better at their craft.
- Project satisfaction: the quality of requirements and project management, and whether the work feels clear and worthwhile.
Tracking DevSat over time turns a vague sense that "morale seems off" into a concrete signal you can investigate and act on. Paired with your quantitative metrics, it completes the picture: the numbers tell you what is happening, and DevSat helps explain why. When lead time creeps up, DevSat often tells you whether the cause is a tooling problem, an organizational one, or something else entirely.
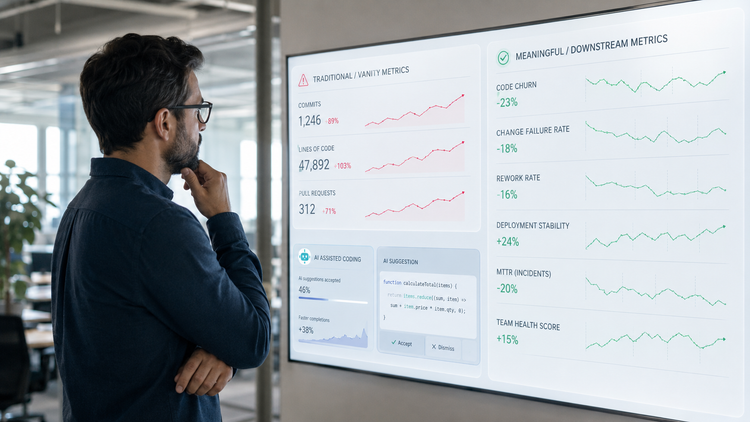
A Note on AI and the Moving Target
One more reason measurement matters now more than ever: AI coding tools are reshaping the work faster than most teams can assess. Recent DORA research has found that AI adoption among developers is now widespread, but its effect on delivery performance is mixed rather than uniformly positive. In some findings, heavy reliance on AI tooling has been associated with reduced delivery stability even as individuals report feeling more productive.
That gap, between feeling faster and being faster, is precisely the kind of illusion a balanced measurement program is built to catch. If you only track how developers feel, you'll miss the stability regression. If you only track delivery, you'll miss the satisfaction gains. You need both, and you need to keep re-measuring, because the ground is still shifting.
The Bottom Line
Productivity in engineering isn't a single number. It's a balance. Speed without quality creates debt. Quality without delivery creates stagnation. And both, without engaged people, are impossible to sustain.
The teams that measure well aren't the ones with the most metrics. They're the ones who track a focused set of outcome-based signals, take sentiment as seriously as throughput, measure teams rather than individuals, review the results honestly, and use what they learn to make the work better. Start small, lean on the frameworks that research supports, combine your sources, listen to your engineers, and let the measurements serve the team, never the other way around.
Further reading and sources
- DORA, Accelerate State of DevOps reports: https://dora.dev/
- Forsgren et al., "The SPACE of Developer Productivity," ACM Queue (2021): https://queue.acm.org/detail.cfm?id=3454124
- Noda, Storey, Forsgren, Greiler, "DevEx: What Actually Drives Productivity," ACM Queue (2023): https://queue.acm.org/detail.cfm?id=3595878
- Kent Beck and Gergely Orosz, "Measuring Developer Productivity? A Response to McKinsey": https://newsletter.pragmaticengineer.com/p/measuring-developer-productivity
- Stack Overflow Annual Developer Survey: https://survey.stackoverflow.co/
- Google re:Work, Project Aristotle (guide to team effectiveness): https://rework.withgoogle.com/
- DX, resources on developer experience measurement: https://getdx.com/


Comments ()