Psychological Productivity Engineering: Building a Framework

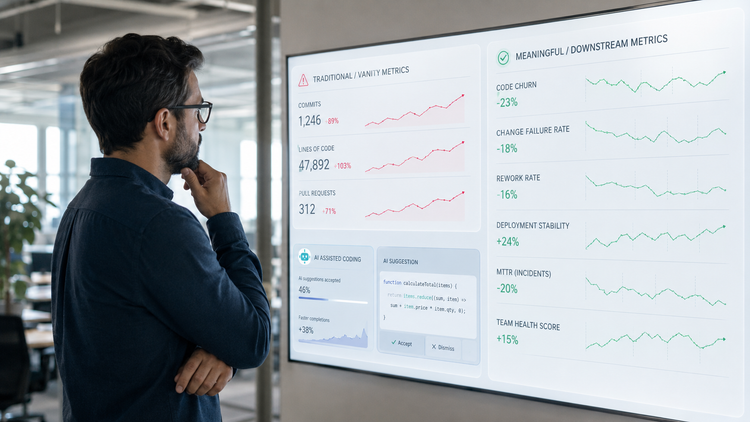
Most engineering organizations measure productivity the way you'd expect: deployment frequency, cycle time, throughput, incident counts. These are useful, but they share a blind spot. They tell you what a team did, and almost nothing about the conditions inside the people who did it. Two teams can post identical delivery numbers while one is thriving and the other is quietly grinding toward burnout. The metrics can't tell them apart, right up until the second team starts losing people.
Psychological Productivity Engineering (PPE) is a framework for closing that gap. The premise is straightforward: the psychological state of engineers is not a soft, secondary concern that sits next to productivity. It is one of the primary inputs to productivity, and it can be engineered with the same rigor we apply to a CI/CD pipeline. You measure it, you find the friction, you fix the friction, you measure again.
This post lays out the full framework: what it measures, how the survey works, how the scoring is calculated, and how a metric we call DevSat ties it all together. Everything here is illustrated with data from a real engineering pulse survey of roughly 200 developers, so the numbers you'll see are examples of what the framework produces in practice.
The Core Idea: Productivity Has a Psychological Substrate
Think of engineering output as sitting on top of a substrate. The substrate is made of things like whether an engineer feels their work is well-scoped, whether they trust their tools, whether they feel safe pushing back on an unrealistic timeline, and whether they can see how their work connects to anything that matters. When the substrate is healthy, output flows. When it cracks, output degrades in ways that are invisible until they aren't.
Traditional metrics observe the output. PPE observes the substrate. The two are complementary, not competing. Delivery metrics are lagging indicators of team health; psychological signals are leading indicators. By the time your cycle time visibly worsens, the psychological erosion that caused it has usually been underway for months. PPE is an attempt to catch it while it's still cheap to fix.
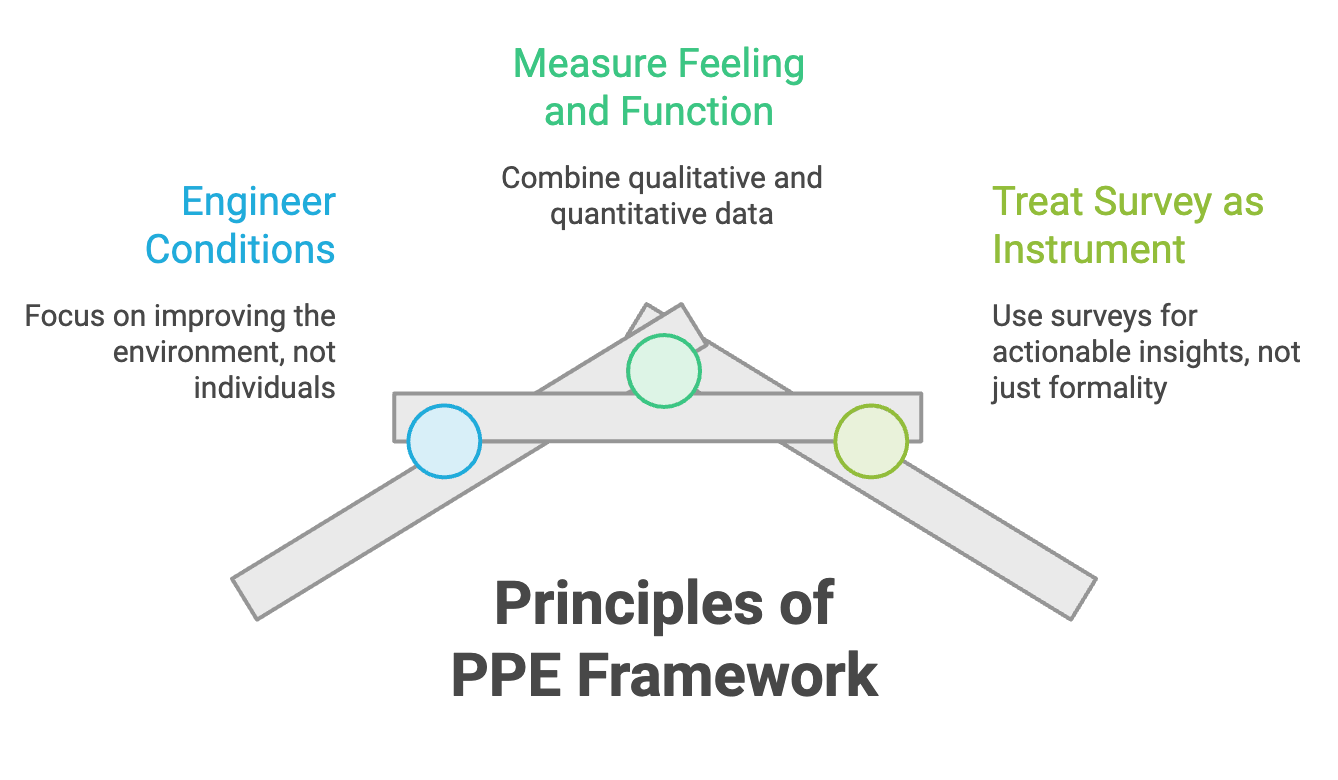
The framework rests on three principles:
Engineer the conditions, not the people. You do not make a team more productive by telling individuals to try harder. You make them more productive by removing the friction in the system around them: the flaky test suite, the unclear requirements, the deploy process nobody trusts. PPE measures those conditions directly.
Measure feeling and function together. A purely quantitative dashboard misses the substrate. A purely qualitative "how's everyone doing" misses the mechanics. PPE deliberately pairs the two, because the interesting signal is usually in the gap between them.
Treat the survey as an instrument, not a formality. An engagement survey that runs once a year and disappears into a slide deck is theater. PPE treats the survey as a measurement instrument that produces a specific, trackable score, the same way a load test produces a latency number.
The Survey Instrument
The heart of the framework is a structured pulse survey. It is built from Likert-scale statements (rated 1 to 5, strongly disagree to strongly agree) grouped into dimensions, plus a small number of open-text and multiple-choice questions for context. The Likert statements produce the score; the open text tells you why the score is what it is.
The instrument is organized into seven dimensions, chosen to span the full psychological substrate of engineering work. Each dimension is measured by three to six statements. Here are the dimensions and representative statements from the real survey:
1. Productivity and Energy. How the engineer experiences their own day-to-day effectiveness and drive.
- "How productive do you feel day to day?"
- "How energized are you by your work?"
2. Code Health. Whether the codebase itself helps or fights the people working in it.
- "Our codebase is easy to contribute to."
- "Our code review process helps us release better code."
- "We spend enough time refactoring code."
3. Releases and CI/CD. Confidence and friction in shipping.
- "It's easy to deploy software."
- "I'm satisfied with the speed and reliability of our CI/CD tooling."
4. Quality and Testing. Whether engineers feel able to ship things they trust.
- "When releasing software to production, I feel confident in the quality of the release."
- "I feel empowered to push back when timelines don't allow for adequate testing."
- "Our test automation infrastructure makes it easy for me to write tests."
5. Planning and Scoping. Whether the work arrives in a shape a person can succeed at.
- "My projects are well-scoped with clear goals."
- "Product requirements are clearly defined, and necessary resources are available before development starts."
6. Collaboration and Clarity. The relational and informational environment.
- "There is a strong sense of teamwork and cooperation among my colleagues."
- "I clearly understand how my work contributes to the company's overall strategy and goals."
7. People and Innovation. Growth, voice, and intellectual stimulation.
- "My opinions are valued in decision-making processes."
- "I have enough opportunities for professional growth and skill development."
- "I feel challenged and intellectually stimulated by my work."
Notice the deliberate mix. Some statements measure feeling (energy, being valued), and some measure function (is it easy to deploy, are requirements clear). That pairing is intentional and central to the framework, because a healthy substrate needs both, and the gap between them is diagnostic. High function with low feeling suggests good tooling but poor culture. High feeling with low function suggests a happy team papering over real friction that will eventually catch up with them.
Two more design choices matter. First, the "empowered to push back" statement is a direct probe of psychological safety, the single most studied driver of team effectiveness, embedded inside a concrete engineering situation rather than asked abstractly. Second, the survey includes a recommend-this question scored 0 to 10, which converts into a team-health net promoter score, giving you one headline number to trend over time alongside the dimensional detail.
How the Score Is Calculated
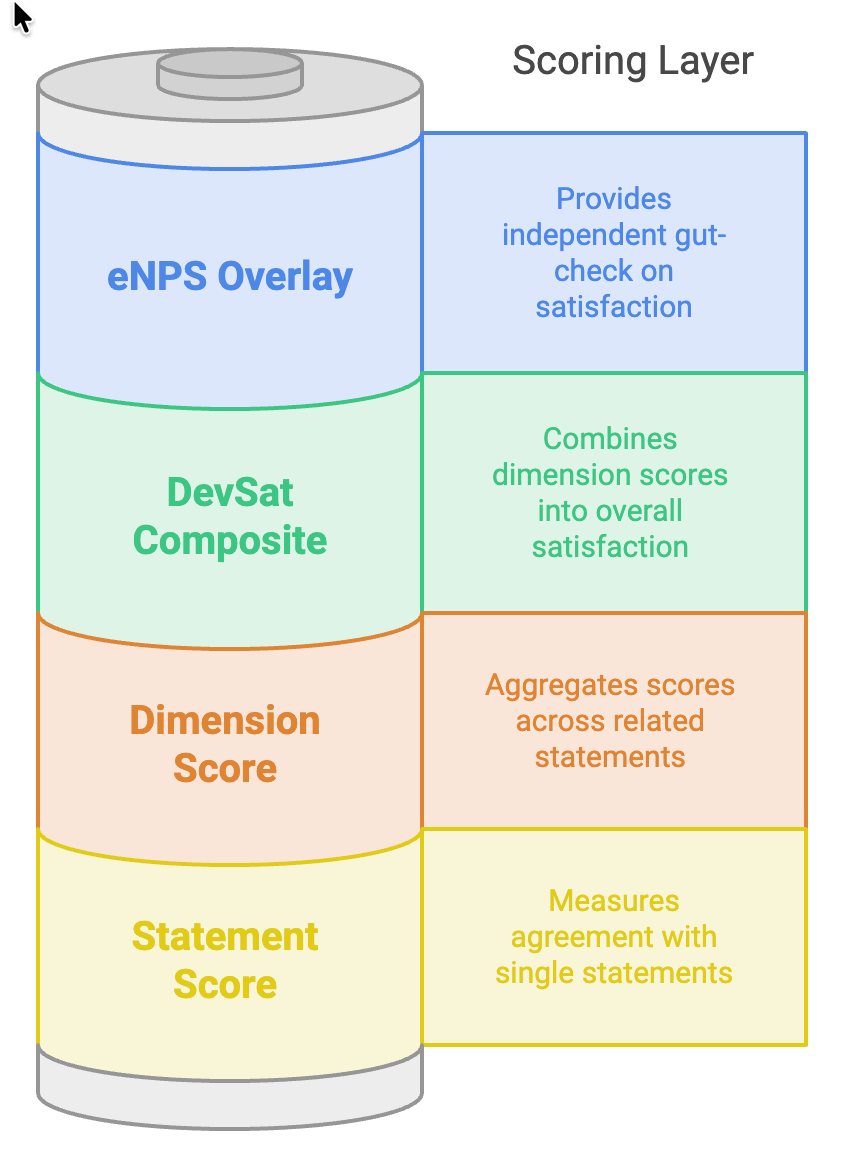
The scoring model turns raw survey responses into numbers you can act on. It works in four layers.
Layer 1: The statement score. Each Likert statement is answered 1 to 5. For any statement you can compute two things: the mean (average agreement) and the favorability, defined as the percentage of respondents who answered 4 or 5. Favorability is often the more actionable of the two, because it answers a concrete question: what fraction of my engineers actively agree that this is working?
Layer 2: The dimension score. A dimension's score is the aggregate across all its statements. Pool every response to every statement in the dimension, then take the mean and the favorability of that pool. This gives each of the seven dimensions a single mean (1 to 5) and a single favorability percentage.
Layer 3: The DevSat composite. Roll all seven dimensions into one overall Developer Satisfaction score, or DevSat. The simplest version is an equal-weighted mean across all statement responses. A more advanced version weights the dimensions by how strongly each correlates with your outcome of choice (retention, delivery, the recommend score), so the composite emphasizes the dimensions that actually move the needle for your organization. Start equal-weighted; add correlation weighting once you have two or three cycles of data.
Layer 4: The eNPS overlay. Separately, compute the net promoter score from the 0-to-10 recommend question: the percentage of promoters (9 to 10) minus the percentage of detractors (0 to 6). This is not folded into DevSat. It sits beside it as an independent gut-check. When DevSat and eNPS agree, you can trust the reading. When they diverge, you've found something worth investigating.
Here is what all four layers look like with real data from a roughly 200-person engineering survey:
| Dimension | Mean (1-5) | Favorable (4-5) |
|---|---|---|
| People and Innovation | 4.25 | 82% |
| Collaboration and Clarity | 4.22 | 81% |
| Productivity and Energy | 4.08 | 79% |
| Releases and CI/CD | 3.99 | 64% |
| Planning and Scoping | 3.78 | 57% |
| Code Health | 3.70 | 56% |
| Quality and Testing | 3.64 | 50% |
| Overall DevSat | 3.99 | 68% |
The story in this table is immediate and would be nearly invisible in a delivery dashboard. The human dimensions are strong: people feel valued, collaboration is healthy, energy is high, all above 79% favorable. The technical-substrate dimensions are the soft spots: quality and testing sits at just 50% favorable, code health at 56%, planning at 57%. This is a team that likes each other and believes in the mission but is fighting its own tooling and unclear scope. That is a precise, prioritized diagnosis, and it points at fixable systems rather than at people.
The framework also shows when a fix lands. Earlier in the year we introduced cloud caching for our monorepo, which cut build times by almost 30%. That improvement didn't just show up in our CI dashboards; it surfaced in the survey too, lifting the Releases and CI/CD scores and validating that the investment reached the people it was meant to help. That is the loop working as intended: change a system, and watch the substrate respond.
From Score to Action
A score you don't act on is worse than no score, because it burns trust. The framework closes the loop in three moves.
Prioritize by the biggest favorability gap. Rank dimensions by favorability, lowest first. In the example data, quality and testing (50%) is the clear first target, followed by code health and planning. You are not trying to fix everything. You are finding the one or two cracks in the substrate that are dragging the most people down.
Read the open text against the low scores. Every dimension has a paired free-response prompt ("we'd love more context"). When a dimension scores low, its comments tell you the mechanism. A low quality-and-testing score plus comments about a slow, flaky test suite is a tooling investment. The same score plus comments about being pressured to skip testing is a psychological-safety and planning problem. Same number, completely different fix. The quantitative score tells you where; the qualitative text tells you what.
Trend it, don't snapshot it. Run the instrument on a regular cadence (quarterly works well) and watch the dimension scores move. A single reading is a diagnosis; a trend is a feedback loop. When you invest in the test suite, the quality-and-testing favorability should climb next cycle. If it doesn't, your fix missed the real mechanism, and the comments will usually tell you why.
Why "Engineering" Is the Right Word
Calling this engineering rather than surveying is a deliberate claim about how to treat it. An engineer doesn't measure latency once and declare victory. They instrument the system, establish a baseline, form a hypothesis about a bottleneck, ship a change, and measure whether the number moved. PPE applies that exact loop to the psychological substrate of the team.
The DevSat score is your latency number. The seven dimensions are your traces, showing which subsystem is slow. The open-text comments are your logs, explaining what actually happened. And the quarterly cadence is your monitoring, telling you whether the last change helped or hurt. Team health stops being a vague matter of vibes and morale and becomes what it should have been all along: a measured system with a baseline, a target, and a feedback loop.
The Bottom Line
Productivity is not just what your team ships. It is the condition of the people doing the shipping, and that condition can be measured and improved with real discipline. Psychological Productivity Engineering gives you the instrument (a structured, dimensional pulse survey), the metric (DevSat, backed by an eNPS overlay), and the loop (prioritize the biggest gap, read the text for the mechanism, fix the system, re-measure).
The payoff is the ability to see problems while they are still psychological, before they harden into attrition and slipping delivery numbers. In the example data, a team with excellent morale and a real tooling problem shows up clearly, months before that tooling problem would have surfaced as missed deadlines and departing engineers. That early warning is the whole point. Measure the substrate, engineer the conditions, and the output takes care of itself.


Comments ()