How AI Disrupts Productivity Measurements
A follow-up to "Beyond Lines of Code: A Practical Guide to Measuring Engineering Productivity."
In one of the previous posts, we argued that engineering productivity has to be measured with a balance of outcome metrics and human sentiment, because any single number invites gaming. We closed with a short warning about AI coding tools reshaping the work faster than most teams can assess. That warning now deserves a full treatment, because AI hasn't just added a new variable to the productivity equation. It has quietly broken several of the instruments we were using to measure it.
This post is about what breaks, why, and what to measure instead.
The Core Problem: AI Decouples Output From Value
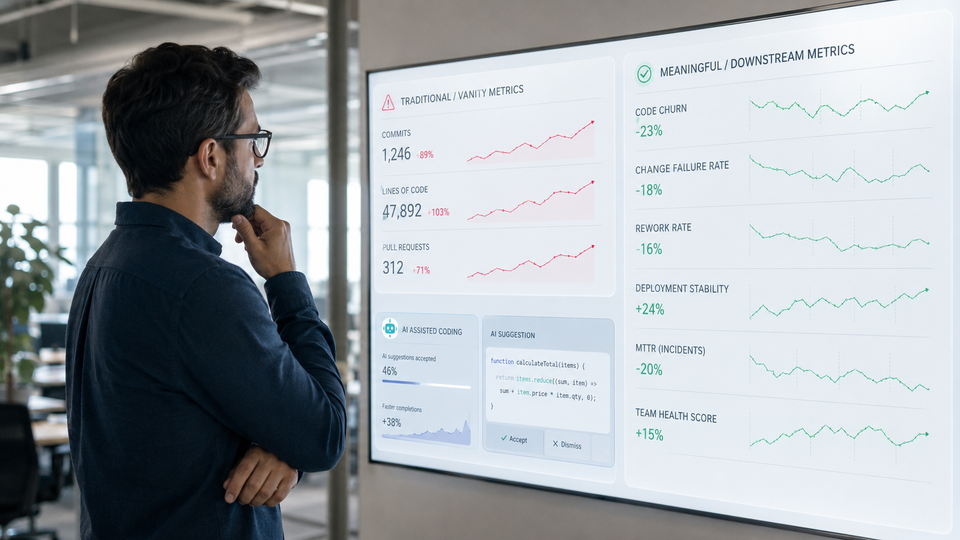
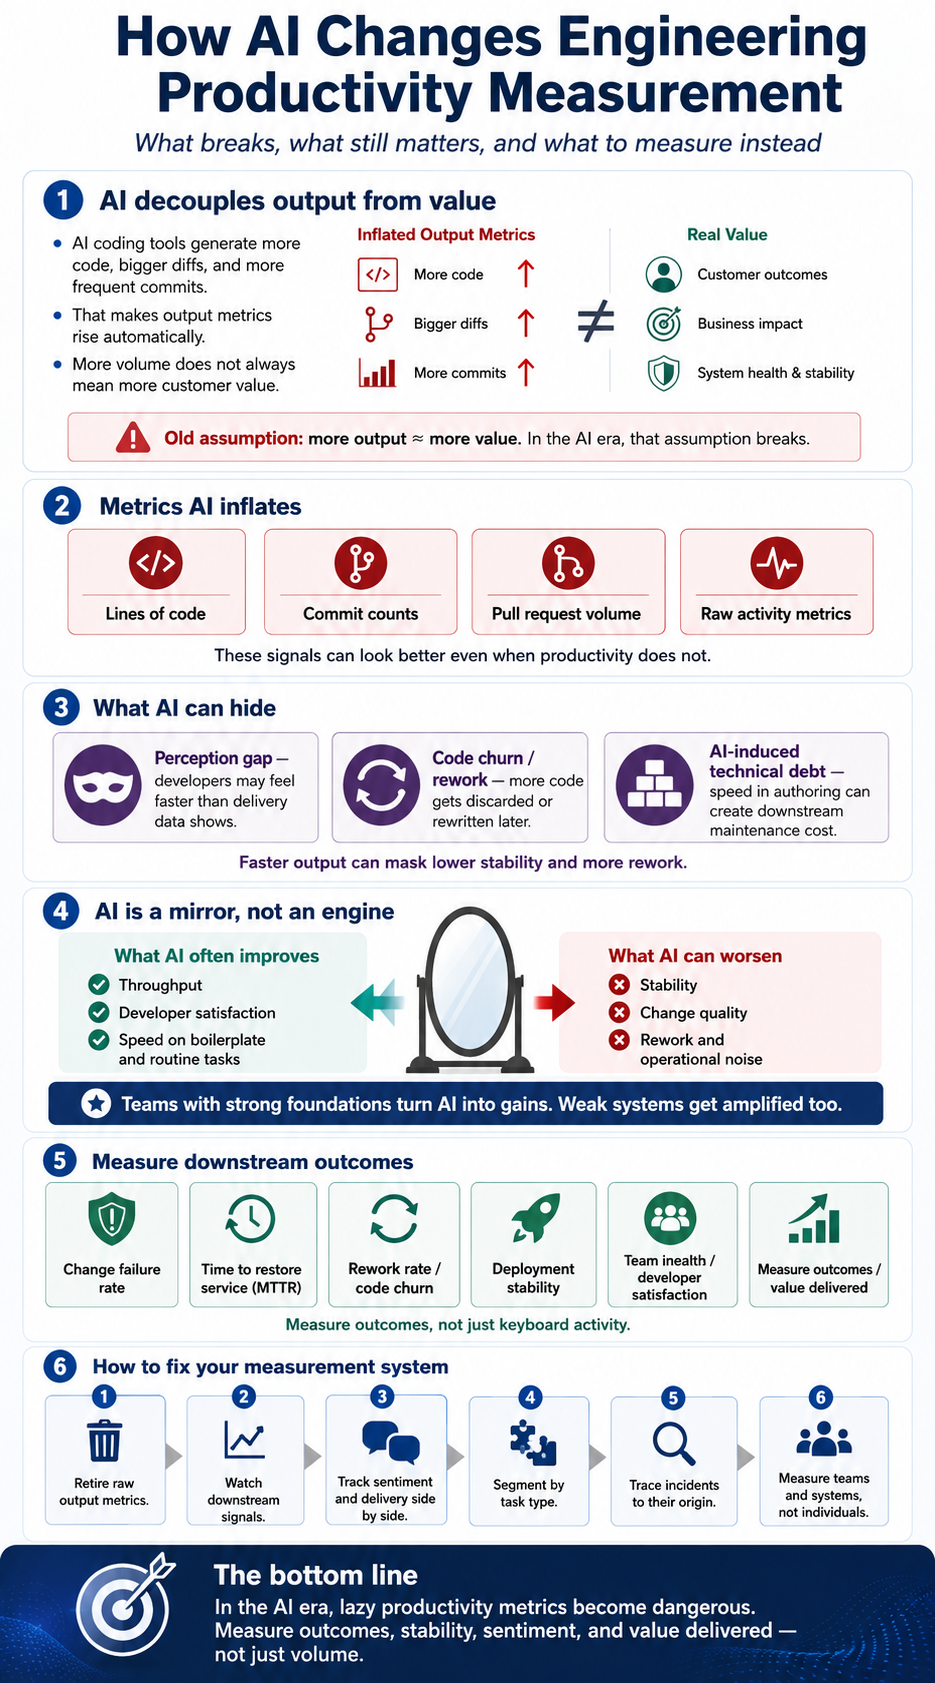
Every traditional productivity metric rests on a hidden assumption: that output is a reasonable proxy for value. More commits, more pull requests, more lines shipped roughly tracked more work getting done. That assumption was always imperfect. AI has severed it almost entirely.
The reason is simple. AI coding assistants are extraordinarily good at generating volume. They produce more code, larger diffs, and more frequent commits with far less human effort per unit. So every metric that counts output now inflates automatically, whether or not any additional value reached a user.
This is Goodhart's Law from the first post, but on fast-forward. A metric that was merely gameable before is now inflated by default, without anyone deliberately gaming it. The developer who accepts an AI suggestion isn't trying to juke the stats. The stats juke themselves.
Independent research makes the decoupling concrete. Vendor studies that report large productivity gains tend to track exactly the metrics that AI inflates: commits, pull requests, and lines of code. But controlled studies that measure actual task completion time tell a different story. A widely discussed randomized study by METR found that the overhead of prompting, waiting, reviewing, and debugging AI output can exceed the raw coding speedup, with a large share of AI generations rejected outright. More code was produced. Less time was necessarily saved. The volume went up while the value did not follow at the same rate.
The Perception Gap
The second thing AI breaks is our trust in self-reported productivity, and this one is more subtle because self-reported satisfaction is exactly what frameworks like SPACE told us to measure.
Here's the tension. Developers overwhelmingly feel more productive with AI. In Stack Overflow's 2025 Developer Survey, a large majority of developers reported using or planning to use AI tools, and most describe the experience positively. Yet when the same population was asked whether AI made them significantly more productive, only a small fraction said yes, and a substantial share reported little to no measurable effect. DX's large-scale telemetry, drawn from a dataset of well over one hundred thousand developers, points to real time savings on the order of a few hours per week for active users, so the effect is not zero. But it is far smaller and far more conditional than the enthusiasm suggests.
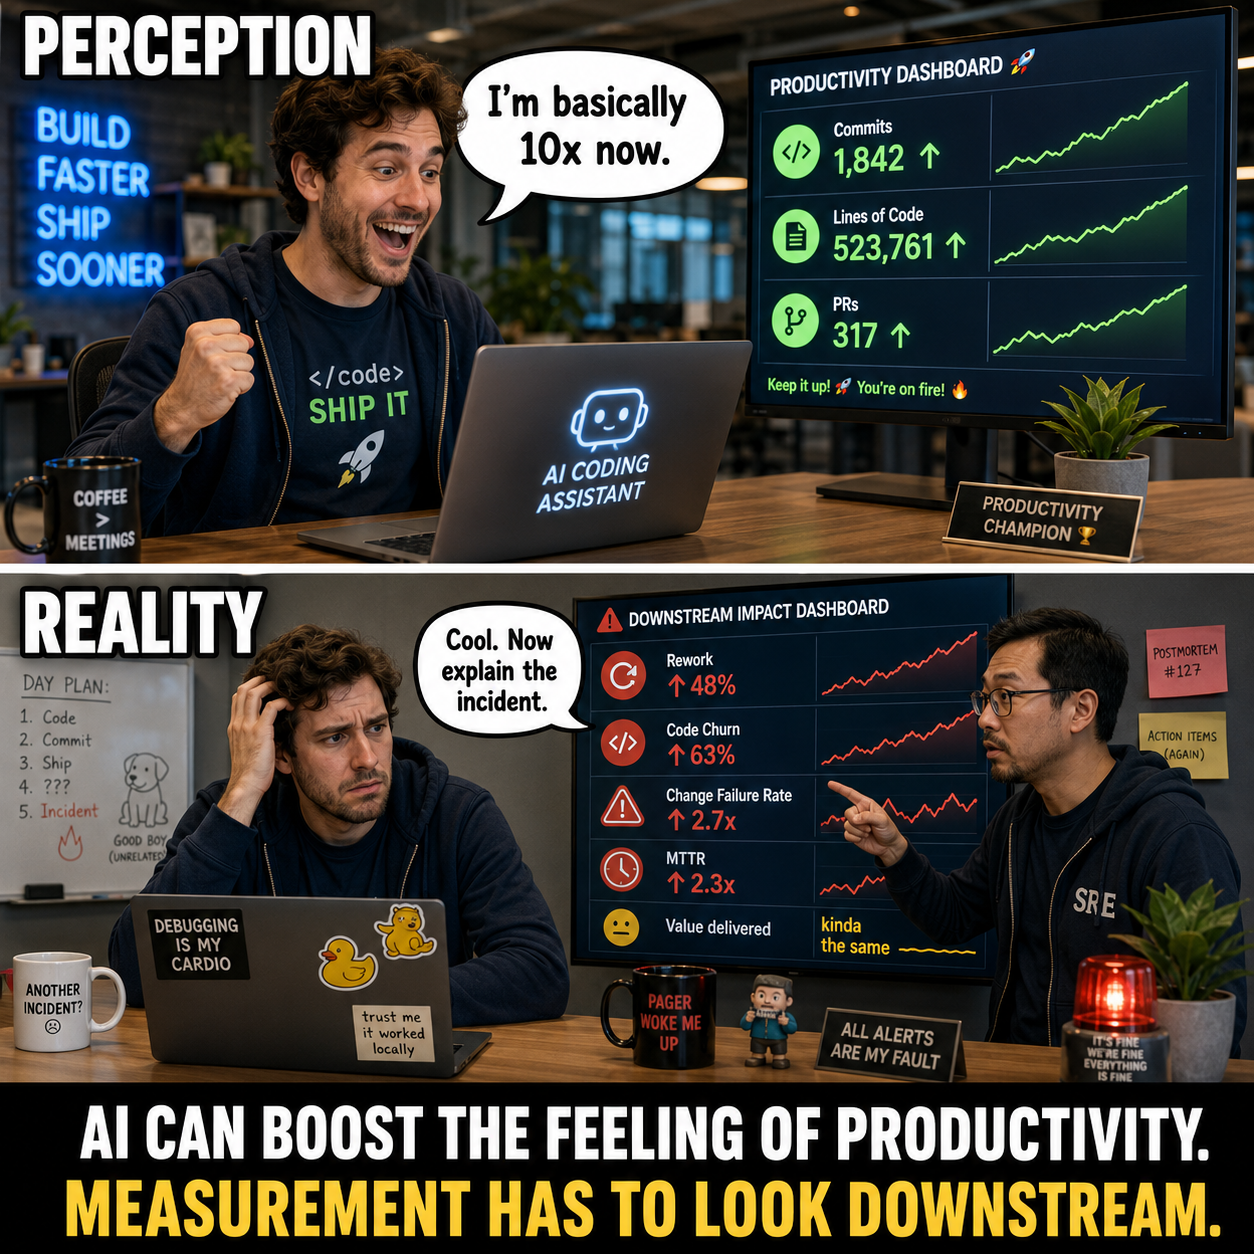
That gap, between feeling faster and being faster, is the measurement problem in a nutshell. If you rely only on delivery metrics, you miss the genuine satisfaction gains AI can bring. If you rely only on sentiment, you'll conclude your team got dramatically more productive when the delivery data may show something much more modest, or even a regression. Neither instrument alone is trustworthy anymore. You need both, precisely because they now disagree.
The Hidden Cost: Code Churn and AI-Induced Debt
The most dangerous disruption is the one that doesn't show up on any output dashboard at all: quality decay masquerading as productivity.
When AI accelerates code creation without a matching acceleration in review, testing, and quality assurance, the excess flows downstream as instability and rework. GitClear's analysis of code churn, defined as the share of code discarded or rewritten shortly after being committed, found that churn has climbed markedly in the AI era. Code that gets thrown away within two weeks of being written is not productivity. It is motion that looks like productivity on a commit graph and shows up as a cost everywhere else.
This is what practitioners have started calling "AI-induced technical debt." AI assistants excel at adding code quickly, but somebody still has to read, understand, and maintain it, and developers generally find reviewing unfamiliar generated code slower and less pleasant than writing their own. So the work doesn't disappear. It relocates, from authoring (which got faster and more visible) to reviewing and maintaining (which got slower and stays invisible to output metrics).
The upshot: a dashboard tracking commits and pull requests can show a team accelerating at the exact moment its real health is declining.
What the Biggest Study Says: AI Is a Mirror, Not an Engine
The most authoritative reading of this shift comes from DORA, whose annual research the first post leaned on. In a sign of how thoroughly AI has taken over the conversation, DORA renamed its flagship report in 2025 from the State of DevOps to the State of AI-Assisted Software Development.
Its central finding is worth sitting with. AI does not automatically improve delivery performance. Instead, it acts as an amplifier of the conditions that already exist. Teams with mature practices, strong platforms, and clear workflows convert AI's speed into real gains. Teams with fragmented tooling and weak foundations find that AI accelerates their problems, generating larger changesets, more inconsistent patterns, and more instability. As one analyst put it, AI does not create elite organizations; it reveals the ones that already were.
The 2025 research confirmed both halves of the tradeoff at once: AI adoption now correlates with higher throughput and, simultaneously, with higher instability. Faster, but not necessarily safer. That single pairing is the reason you cannot measure AI's impact with a throughput metric alone. Throughput is now the half of the story most likely to look good, while the cost hides in the stability numbers.
DORA also retired its old "low to elite" performance tiers in favor of seven team archetypes that weigh delivery, well-being, and culture together, a direct acknowledgment that a one-dimensional performance label no longer describes what AI is doing to teams.
What the AI Tools Themselves Report (And How to Read It)
Here's a twist worth appreciating: the same AI tools that disrupt your measurements now ship with their own measurement dashboards. Claude Code, GitHub Copilot, Cursor, and the rest all expose analytics about how they are being used. These numbers are genuinely useful, but only if you understand exactly what they do and do not measure. Read naively, they reproduce every trap described above. Read correctly, they become a valuable input to a broader picture.
What Claude Code exposes
Anthropic's analytics for Claude Code, available on Team and Enterprise plans and through a Console dashboard and Admin API for API customers, report a consistent set of signals: lines of code accepted, suggestion accept rate (the share of Edit, Write, and similar suggestions a developer keeps), daily active users and sessions, and, where GitHub integration is enabled, contribution metrics that tie Claude Code sessions to merged pull requests. That last category counts PRs and lines of code that shipped with Claude Code involvement, along with the percentage of all merged PRs that were AI-assisted.
Three details matter enormously for interpretation. First, the contribution numbers are deliberately conservative. Only "effective lines" count (lines with real content, excluding blanks, brackets, and trivial punctuation), and lock files, generated code, and build artifacts are filtered out, so the reported figures understate the tool's raw footprint by design. Second, PR attribution works by matching merged diffs against session output within a window running from roughly three weeks before a merge to a couple of days after, and code a human later rewrote by more than about a fifth is excluded from the match. Third, the accepted-lines metric explicitly does not track code that was accepted and then deleted later.
What GitHub Copilot exposes
Copilot's usage metrics, surfaced through enterprise and organization dashboards plus a REST API and NDJSON exports, cover a similar shape with more surface area: daily and weekly active users, suggestion counts and acceptance rates, lines of code suggested versus accepted, breakdowns by IDE, language, and model, chat and agent-mode activity, and pull-request lifecycle data such as PR creation, merge counts, and median time to merge. Copilot usefully distinguishes active users (any activity) from engaged users (those who actually accepted a suggestion or generated a PR summary), which is a more honest adoption signal than a raw login count.
How to read these numbers correctly
The single most important thing to understand is that every native metric these tools report is a usage or adoption number, not an outcome number. Lines accepted, accept rate, active users, sessions, tokens spent: all of it describes activity inside the tool, and none of it tells you whether the business moved. A developer accepting five hundred lines is not the same as a customer problem being solved. The vendor's dashboard, by its nature, stops at the vendor's own edge.
With that framing, here is how to use each type of signal without being misled:
- Treat "lines of code accepted" as an adoption signal, never a productivity one. It is the purest example of the inflation problem from earlier in this post. It answers "is my team using the tool?" not "is my team more productive?" Rising accepted lines tells you adoption is growing. It tells you nothing about value, and used as a performance target it will mislead you exactly as raw LOC always has.
- Read acceptance rate as a trust and quality signal, not an output one. A healthy or rising accept rate suggests developers find the suggestions genuinely useful. A low or falling one suggests friction, poor fit, or a need for better prompting practices. GitHub's own guidance is to look for patterns across signals rather than fixate on one number: a steady active-user count paired with a rising acceptance rate is a credible sign of growing value.
- Lean on adoption metrics for rollout decisions, not performance reviews. Active users, engaged users, and sessions are excellent for answering whether an investment is landing, where enablement is needed, and which teams have stalled. They are the right tool for managing a rollout and the wrong tool for judging an individual.
- Use the tools' PR-level attribution as a bridge to your real metrics. The most valuable thing these dashboards offer is the link between AI assistance and merged pull requests. That connection lets you ask the question that actually matters: for PRs that were AI-assisted, what happened to change failure rate, rework, and time to restore service downstream? The tool tells you which PRs it touched; your own DORA-style metrics tell you whether those PRs held up.
Four cautions before you present any of these numbers
- Don't sum dashboards across tools. If your org runs Copilot and Claude Code and Cursor side by side, each vendor counts its own way, and each attributes a shared PR to itself. Adding the dashboards together double-counts every PR that two tools touched. There is no shared referee across vendors.
- Mind the attribution windows and exclusions. Conservative counting, normalization rules, and time windows differ by tool. Two dashboards reporting "AI-assisted lines" are not measuring the same thing, so cross-tool comparisons are apples to oranges.
- Remember what's excluded. Deleted-after-acceptance code, heavily rewritten code, generated files, and lock files are all filtered out to varying degrees. The numbers are directional, not billing-grade truth. Spend figures in particular are usually estimates, not exact costs.
- These are metadata, not surveillance, and should stay that way. The dashboards report usage and contribution metadata, not the prompts developers write or the content of their conversations. Keep it that way in practice as well as in policy. The moment a leaderboard of "lines accepted" becomes a stack-ranking tool, you have recreated the individual-ranking failure mode, and developers will optimize for accepting suggestions rather than for doing good work.
The right mental model: these tool-native metrics are a strong input telling you about adoption, trust, and where AI is touching your codebase. They are not the output measure of whether your engineering organization got better. Pair them with the downstream, outcome-based metrics below, and they become genuinely valuable. Read them in isolation, and they are just a more sophisticated way of counting lines of code.
This is exactly the gap that a dedicated measurement layer is meant to close, and it's one reason we're evaluating TargetBoard as part of our own tooling. It sits on top of the sources already discussed (Jira, GitHub, CI/CD, and the AI coding tools themselves), lets you define KPIs and set explicit targets against them, and is built to connect AI usage data to delivery and quality outcomes rather than leaving it stranded in each vendor's dashboard. That combination, focusing on the KPIs that matter, holding them to targets, and measuring whether AI is actually improving performance, is precisely the discipline this post argues for.
How to Fix Your Measurements for the AI Era
None of this means measurement is hopeless. It means the specific instruments have to be re-calibrated. Building on the implementation approach from the first post, here is what changes when AI enters the picture.
1. Retire raw output metrics entirely. Lines of code, commit counts, and raw pull-request volume were weak signals before AI and are actively misleading now, because AI inflates all of them independent of value. If a metric goes up simply because a developer accepted more suggestions, it is measuring the tool, not the team. Stop reporting these upward to leadership.
2. Watch the downstream, not the keyboard. The genuine signal of AI's impact has moved past the moment of authorship. Track code churn or rework rate (how much code gets discarded shortly after being written), change failure rate, and time to restore service. These catch the instability that AI introduces and that output metrics conceal. DORA's rework rate exists for exactly this reason.
3. Separate feeling from delivery, and expect them to disagree. Keep measuring developer satisfaction, because it is real and it matters. But hold it side by side with hard delivery data rather than treating either as the truth. When sentiment soars and delivery stability slips, that divergence is not noise. It is the most important thing your dashboard is telling you.
4. Segment by task type. AI compresses different kinds of work by very different amounts. It may dramatically speed up boilerplate and tests while barely helping, or actively hindering, complex refactors and novel design. Blending everything into one "productivity" number hides this. Splitting delivery metrics by category (features, bug fixes, refactors) restores the signal.
5. Trace incidents to their origin. A growing practice among engineering leaders is tagging production incidents by source: AI-generated code, human-written code, or a gap in review. This is one of the cleanest ways to tell genuine productivity gains apart from deferred technical debt, because it directly connects the tool to its downstream consequences.
6. Measure the system, not the individual, even more strictly than before. The first post warned against ranking individuals. AI sharpens that warning. Because AI inflates individual output metrics so easily, any attempt to rank engineers by volume in the AI era measures little more than who accepts the most autocomplete. Keep the lens on teams and systems.
The Bottom Line
AI hasn't made engineering productivity unmeasurable. It has made the lazy ways of measuring it actively dangerous, because it inflates output metrics automatically, widens the gap between how fast developers feel and how fast they deliver, and pushes real costs downstream where simple dashboards can't see them.
The response is the same principle as before, applied with more discipline: measure outcomes rather than output, hold sentiment and delivery data up against each other instead of trusting either alone, watch the downstream signals of stability and rework, and always measure the system rather than the person. AI is a mirror. What it reflects depends entirely on whether you are measuring the right things. Point it at commit counts and it will flatter you. Point it at value delivered and it will tell you the truth.
Further reading and sources
- DORA, State of AI-Assisted Software Development (2025) and Accelerate State of DevOps (2024): https://dora.dev/
- InfoQ summary of the 2025 DORA report, "AI Is Amplifying Software Engineering Performance": https://www.infoq.com/news/2026/03/ai-dora-report/
- RedMonk, "DORA 2025: Measuring Software Delivery After AI": https://redmonk.com/rstephens/2025/12/18/dora2025/
- DevOps.com, "DORA 2025: Faster, But Are We Any Better?": https://devops.com/dora-2025-faster-but-are-we-any-better/
- Stack Overflow Annual Developer Survey (2024 and 2025): https://survey.stackoverflow.co/
- METR study on AI's effect on experienced developer task completion time: https://metr.org/
- GitClear, research on AI coding assistants and code churn / quality: https://www.gitclear.com/
- DevOps.com, "AI in Software Development: Productivity at the Cost of Code Quality?": https://devops.com/ai-in-software-development-productivity-at-the-cost-of-code-quality-2/
- Forsgren et al., "The SPACE of Developer Productivity," ACM Queue (2021): https://queue.acm.org/detail.cfm?id=3454124


Comments ()