Tokenmaxxing: Why AI Usage Metrics Don’t Measure Productivity

Part of a series on measuring engineering productivity. See also "Beyond Lines of Code" and "How AI Disrupts Productivity Measurements."
There's a new number climbing on engineering dashboards, and a lot of leaders have quietly started treating it as a productivity metric. It's AI usage: tokens consumed, prompts sent, seats activated, percentage of code written by AI. The logic feels intuitive. We're paying for these tools, adoption proves they're working, so more usage must mean more value.
It doesn't. And the belief that it does has become one of the most expensive measurement mistakes of the current cycle. This post is about what not to measure, why these metrics are so seductive, and what to put in their place.
The Metric With a Name Now: "Tokenmaxxing"
The practice of treating AI token consumption as a proxy for productivity has become common enough that it has earned a label: tokenmaxxing. It's the belief that burning more tokens signals more work, and it is spreading through internal leaderboards, token budgets, and board decks because usage is the easiest AI number to show. It's visible, it moves every week, and it looks rigorous on a slide.
It is also, as one analysis put it plainly, lines of code with a fresh coat of paint. We spent decades learning that counting lines of code was a broken way to measure developers. Tokenmaxxing reintroduces exactly that error under a new name. Token consumption is an input. Productivity is an outcome. Confusing the two is the whole mistake.
Even Salesforce has taken a public position against it, launching a new metric it calls "agentic work units" specifically as a rebuttal to what it describes as Silicon Valley's fixation on tokenmaxxing, on the argument that raw token consumption is a vanity metric that should be replaced with something tied to actual results.
Why These Metrics Are So Tempting
It's worth being honest about why smart leaders fall into this. Tokenmaxxing didn't appear because anyone decided usage was a good measure of productivity. It appeared because no one had a better answer ready when the CFO asked what all this AI spend was buying.
For the last year and a half, boards have been funding AI tooling aggressively and demanding justification. Engineering leaders, under pressure to show ROI they hadn't yet figured out how to calculate, reached for the number that was sitting right there: usage. It looks like measurement. It feels like progress. And it fills the awkward silence when someone asks whether the investment is paying off.
The problem is that it answers a question nobody actually cares about. "Are we using AI a lot?" is not the question. "Is AI making us better?" is.
The Four Metrics to Stop Treating as Productivity
Here are the specific numbers that show up on AI dashboards and get mistaken for productivity. Each one is a legitimate activity signal and a terrible productivity signal.
1. AI spend and token consumption. This is the headline offender. Higher spend is a cost, not an achievement. An engineer who burns a large token budget generating five hundred lines of mediocre, buggy code has consumed more than one who used AI sparingly to solve a hard architectural problem in twenty lines. Under a token-volume lens, the first engineer looks more productive. That is exactly backwards. Spend is the denominator in your ROI calculation, never the numerator.
2. "Percentage of code written by AI." This metric implies that a higher share is inherently better, which is a strange thing to optimize for. It says nothing about whether that code was correct, necessary, or maintainable. A codebase that is eighty percent AI-generated and churning constantly is in worse shape than one that is twenty percent AI-generated and stable. The percentage measures delegation, not value.
3. Prompts sent, messages, sessions, and seats activated. These are adoption signals, and they are useful for exactly one purpose: answering whether a rollout is landing. The moment they become performance targets, they invite the appearance of adoption rather than the substance of it. When a company ties bonuses to using an AI assistant a minimum number of times per week, as some have, employees optimize for frequency, not for the quality of what the tool helps them produce. Using AI often and badly beats using it rarely and well, purely because only the former shows up on the dashboard.
4. Suggestion acceptance rate, read as output. Acceptance rate is a genuinely useful trust signal, as the previous post in this series argued. But it is not a productivity measure. A thirty percent acceptance rate tells you developers kept thirty percent of suggestions. It says nothing about whether those suggestions shipped faster, reduced bugs, or moved a revenue number. Read it as a gauge of tool fit, never as a scoreboard of value delivered.
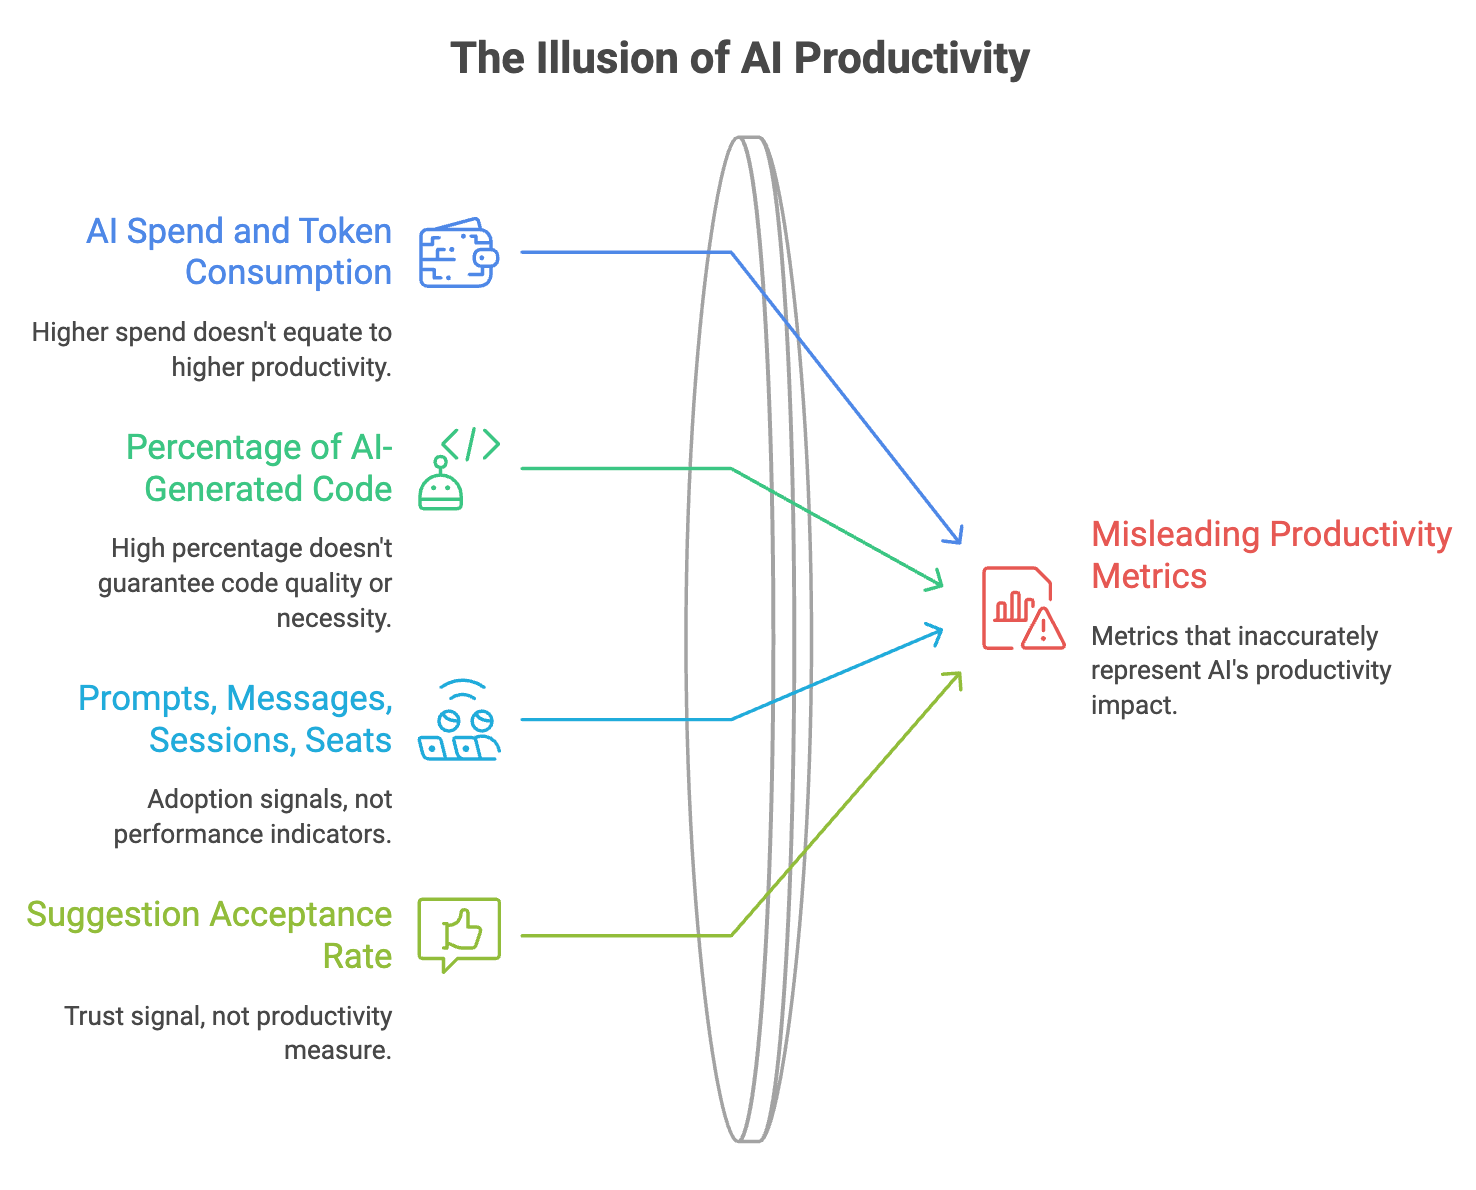
The common thread: every one of these is an input or an activity count, and none of them is an outcome. The instant you turn any of them into a target, Goodhart's Law takes over and people optimize for the metric instead of the work. On a token leaderboard, prompts get re-run, context gets inflated, and entire codebases get pulled in "just in case." Within weeks the leaderboard stops reflecting productivity and starts actively producing the opposite of it.
The Data: Why Volume and Value Have Diverged
This isn't a philosophical objection. The gap between AI activity and AI value is now measurable, and it is wide.
An analysis of two years of data across roughly 22,000 developers and 4,000 teams found that AI usage is genuinely accelerating throughput: task completion up meaningfully, epics completed per developer up sharply, code-specific tasks up dramatically. That's the half of the story the usage dashboards capture, and it's real.
The other half is the part those dashboards miss entirely. In the same data, bugs per developer rose substantially, median review time stretched to several times its previous length, a meaningful share of pull requests began merging with no review at all, and code churn, the proportion of code discarded shortly after being written, spiked enormously in high-adoption environments. The researchers summed it up in one line worth memorizing: throughput measures what shipped, not what survived.
This is the AI productivity paradox. Code velocity rises thirty to fifty percent, but feature delivery and defect rates do not improve proportionally, and sometimes move the wrong way. If you are only watching usage and throughput, you will see the acceleration and completely miss the rising cost trailing behind it. Meanwhile, one industry survey found that fewer than a third of AI decision-makers can currently tie AI value to profit-and-loss changes at all. The measurement gap is not a minor reporting problem. It is the central problem.
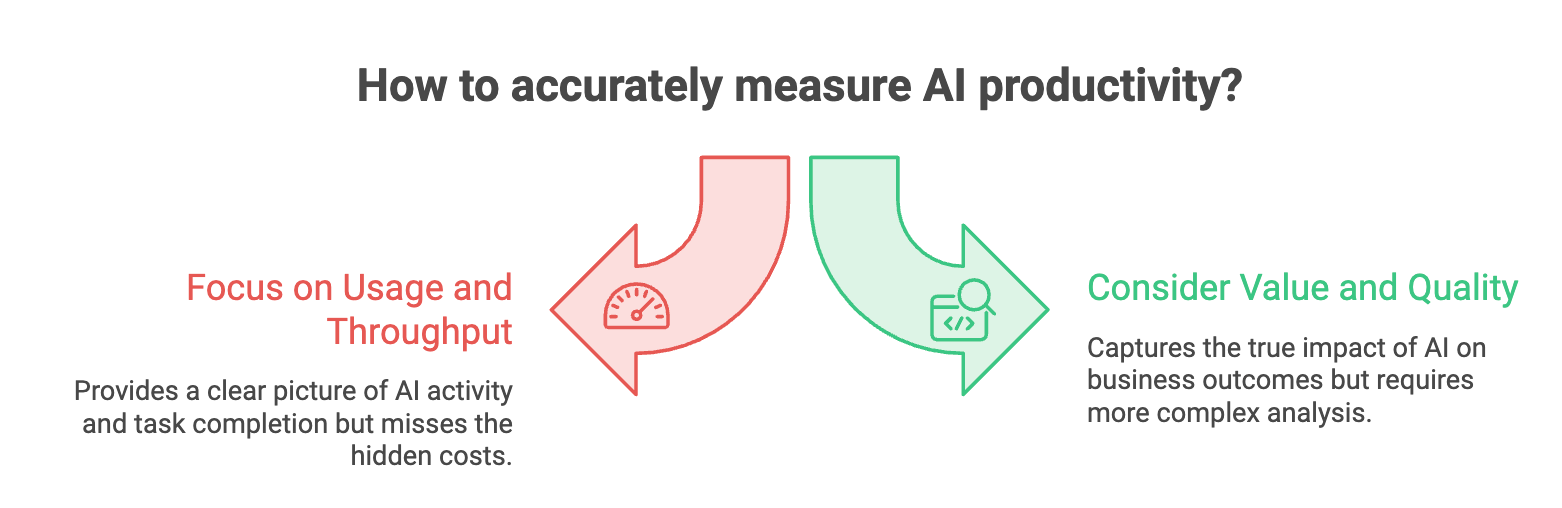
What to Measure Instead: ROI, Not Consumption
The fix is to stop measuring how much AI you used and start measuring what it produced, for whom, and at what cost. Concretely, that means building your measurement around three things.
1. Anchor every AI deployment to a business outcome, defined in advance. Before rolling out a tool, write down the specific outcome it is supposed to change. For coding assistants, that's usually cycle time (idea to production), throughput of features delivered (not code written), defect and change-failure rates, and time to restore service. For a support copilot it might be first-contact resolution; for sales, deal velocity. Then measure whether that outcome actually moved. If usage is high and the outcome is flat, that gap is your signal to act, not a number to celebrate.
2. Calculate real ROI, including the hidden costs. ROI is value delivered divided by total cost of ownership, and most teams get the denominator wrong by counting only the license or token bill. The real cost includes the review time AI-generated code demands, the rework when churn is high, the incidents that trace back to unreviewed merges, and the developer hours spent understanding code they didn't write. One engineering director reported that his organization's mandated AI tooling ended up costing roughly three times the salary cost of the people using it once everything was counted. A number that looks like a productivity win in isolation can be a net loss once total cost of ownership is honest.
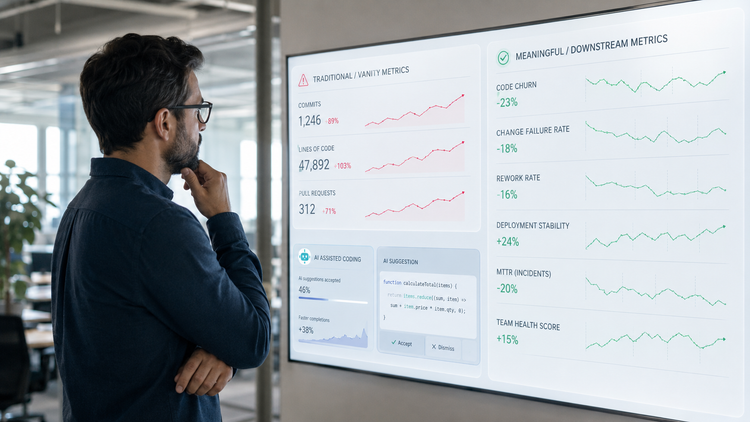
3. Put inputs and outputs side by side, and watch the ratio. The single most useful dashboard design is to place consumption metrics (seats, tokens, spend) next to outcome metrics (features shipped, cycle time, defect rate, incidents), and normalize the outcomes per unit of value delivered. Rising consumption with flat or declining outcomes is the tokenmaxxing trap made visible. This framing also lets you watch AI's specific bad habits, like doing more than asked (files touched per pull request) and verbosity (pull request size), which quietly inflate review burden and rework.
A practical starting move, if this all feels abstract: pick your three most visible AI deployments, write down the one business outcome each was meant to improve, and measure whether it moved. Doing that for three deployments will tell you more about the real state of AI in your organization than any token leaderboard ever will.
Keep the Usage Data. Just Demote It.
None of this means the usage numbers are worthless. Adoption data has a real job: it tells you where a rollout is landing, which teams have stalled, and where enablement is needed. The error is not tracking usage. The error is letting usage impersonate productivity.
So keep the token counts and acceptance rates on the dashboard, but label them correctly and put them at the bottom of the hierarchy: activity metrics at the base, quality metrics in the middle, business outcomes at the top. Treat usage as a diagnostic, not a performance indicator. High usage in a team whose outcomes haven't improved is a flag to investigate, not a badge to award.
The Bottom Line
We have been here before. In the early internet, companies bragged about website hits. In early social media, they boasted about follower counts. Both were easy to measure, easy to inflate, and nearly useless for understanding whether the business was actually working. AI usage metrics are the 2026 entry in that lineage, and they will age exactly as badly.
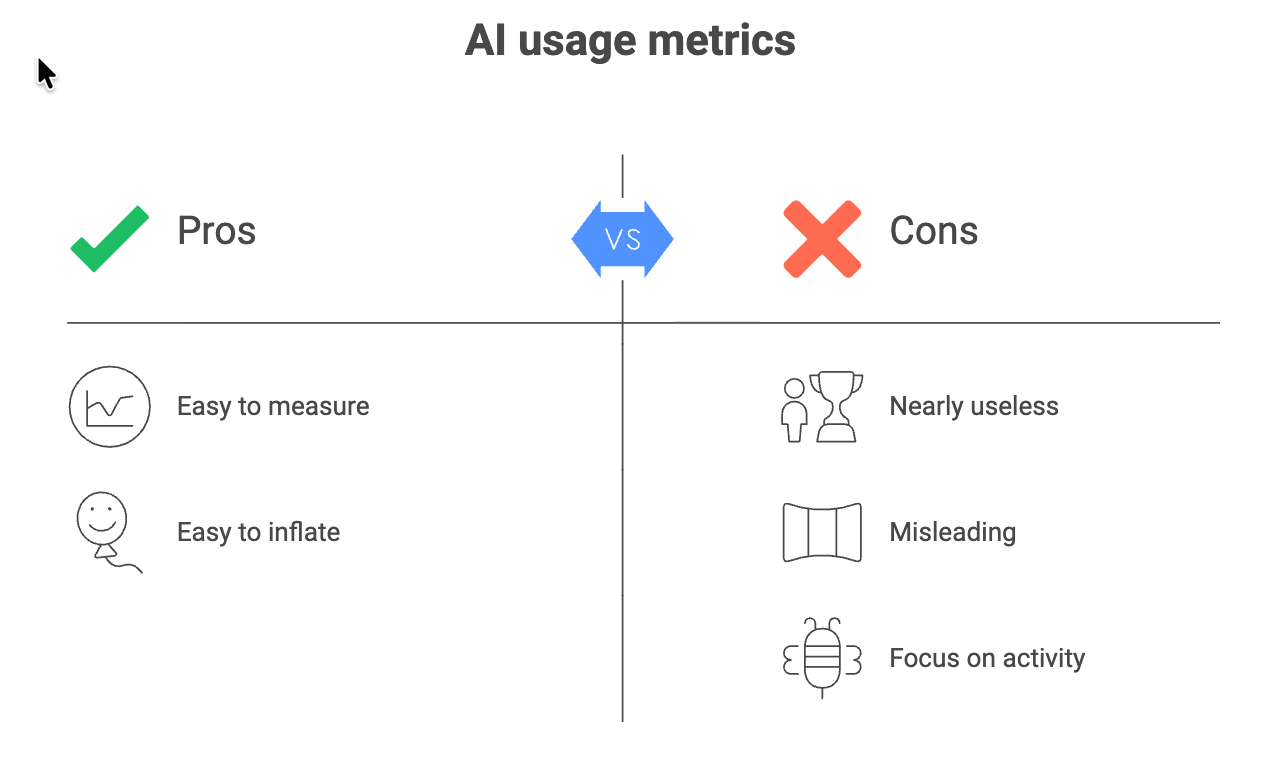
The question that survives every hype cycle is not "how much did we use?" It is "what can we now do that we couldn't before, and what did it cost us to get there?" Measure spend as a cost, not an accomplishment. Measure outcomes, not activity. Measure the return, not the consumption. Get the scoreboard right, and the token conversation shrinks to what it always should have been: a line item, not a headline.
Frequently Asked Questions
What is tokenmaxxing?
Tokenmaxxing is the practice of treating AI token consumption or AI usage volume as a proxy for productivity. It confuses an input — how much AI was used — with an outcome — whether engineering teams actually delivered better results.
Is AI token usage a productivity metric?
No. Token usage can show adoption and activity, but it does not tell you whether teams shipped faster, improved software quality, reduced defects, or created more business value. AI usage should be treated as a diagnostic metric, not a productivity KPI.
What AI metrics should engineering teams measure instead?
Engineering teams should focus on outcomes such as cycle time, features delivered, defect rates, change failure rate, review time, incidents, code churn, and time to restore service. These should then be compared with the total cost of AI tooling to understand actual ROI.
Is the percentage of code written by AI a useful metric?
It can be useful as an adoption signal, but it should not be treated as a measure of productivity. A higher percentage of AI-generated code does not necessarily mean the code is correct, necessary, maintainable, or delivering more value.
How should companies measure AI ROI in software engineering?
Measure the outcomes an AI tool was intended to improve and compare those gains with its total cost of ownership. That cost should include licenses and token spend as well as review time, rework, code churn, incidents, and the engineering effort required to understand or maintain AI-generated code.
Further reading and sources
- Axios, "Salesforce unveils new AI ROI metric" (on tokenmaxxing): https://www.axios.com/2026/04/15/tokenmaxxing-ai-roi-metrics
- Faros AI, "Tokenmaxxing: Why token consumption isn't AI engineering productivity" (22,000-developer dataset): https://www.faros.ai/blog/tokenmaxxing
- Olakai, "Tokenmaxxing: Why Token Leaderboards Miss AI ROI": https://olakai.ai/blog/tokenmaxxing-claudeonomics/
- Diginomica, "Measuring productivity purely by AI token usage misses the point": https://diginomica.com/measuring-productivity-purely-ai-token-usage-misses-point-there-are-far-better-metrics-monitor
- SoftwareSeni, "Measuring ROI on AI Coding Tools Using Metrics That Actually Matter": https://www.softwareseni.com/measuring-roi-on-ai-coding-tools-using-metrics-that-actually-matter/
- TechRadar Pro, "'Vanity metrics' are jeopardizing AI ROI": https://www.techradar.com/pro/vanity-metrics-are-jeopardizing-ai-roi
- SPK and Associates, "How Software Teams Can Measure and Maximize AI Coding ROI": https://www.spkaa.com/blog/how-software-teams-can-measure-and-maximize-ai-coding-roi
- DORA, State of AI-Assisted Software Development (2025): https://dora.dev/



Comments ()